


U.S. Potato Exports Set Another Record
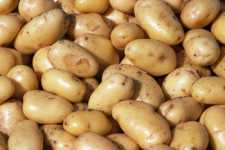
Total U.S. potato and product exports for fiscal year (FY) 13 (July 1, 2012 to June 30, 2013) increased 4% in value to $1,639,911,793 and also rose 4% in volume to 1,561,896 metric tons (MT) — both record levels. The fresh weight equivalent of these exports is 65,711,211 hundredweight, or approximately 17% of U.S. potato production.
U.S. potato and product exports have grown 133% in value and 79% in volume over the last 10 marketing years.
U.S. exports of frozen potato products in FY13 increased 2% by volume to 926,553 MT and 6% by value to $1,048,728,731. This is the first time exports of frozen products have surpassed the $1 billion mark. Exports to the United States Potato Board’s (USPB) target markets increased 4% in volume. The increase in exports to target markets was led by a 28% increase in shipments to Mexico; 26% increase to South Korea, 8% increase to Malaysia, and a 15% increase to Vietnam. These increases overcame a 6% reduction in exports to Japan due to the 26% devaluation of the Japanese Yen which resulted in a curb on all imports.
U.S. exports of fresh potatoes to the world increased 13% by volume to 456,366 MT, but were down 4% by value to $196 million. Fresh exports include table-stock potatoes as well as chip-stock, and in the case of Canada, potatoes for frozen processing. The decline in the value of exports was mainly due to the reduction in unit value of exports to Canada and Mexico, though volume of exports to both markets did increase.


Exports of fresh potatoes to the USPB’s target markets increased 24% in volume and 5% in value during FY13. The largest target market is Mexico with exports up 10% in volume to 79,719 MT. Exports to the targeted countries in Central America (table-stock and chip-stock) increased 47% to 11,761 MT. The Philippines (chip) grew 53% to 7,585 MT; Taiwan (chip and table-stock) was up 85% to 19,695 MT; Thailand (chip) rebounded up 32% to 11,533 MT; Japan (chip) increased 19% to 17,861 and Malaysia (chip and table-stock) was up 7% to 16,648. The newest market, Vietnam (chip and table-stock) increased 377% to 2,323 MT, while the traditional table-stock markets of Singapore and Hong Kong, were up 3% to 6,126 MT and 12% to 4,071 MT, respectively.
U.S. exports of dehydrated potatoes in FY13 were down 3% by volume to 114,408 MT, but stayed at virtually the same value of $192 million. Exports to the USPB’s target markets declined 3% in volume to 61,355 MT, and dropped 1% in value to $92 million. Exports to Mexico, the largest target market increased 4% to 22,466 MT, while exports to the second largest market, Japan, declined 11% to 19,813 MT, reflecting a 29% decline in total dehy exports to Japan.
The U.S. lost market share to the European Union (EU) in China and Korea. As short supplies in the U.S. in 2011 caused customers to switch to more plentiful supply from the EU, the continued lower price for this product has made it hard to get them to switch back to U.S. Good growth in U.S. exports was recorded for Indonesia, Thailand, and Vietnam.
Export statistics for seed potatoes are unreliable as fresh potatoes get incorrectly categorized as seed and seed gets incorrectly categorized as fresh. USDA figures show U.S. seed potato exports to all markets down 5% by volume and 85 by value to $8,251,919. However, USPB figures for its target markets show record levels of exports of 4,225 MT valued at $3 million, an increase of 40% over FY12 exports of 3,031 MT and $2 million. The biggest increase was in exports to Brazil which reached 1,050 MT after being zero in FY12. Exports to the Dominican Republic grew from 725 MT to 950 MT in FY13, while exports to Africa rose to 225 MT. Exports to Nicaragua, Uruguay and Sri Lanka were off slightly, but should rebound in FY14.
USPB anticipates U.S. potato and product exports to continue to grow in FY14 (July 2013 – June 2014). The size of future increases will be impacted by fluctuations in exchange rates, economic growth in the markets and the relative supply and price of competitor products.
For more information on the USPB, go to www.uspotatoes.com.
Subscribe Today For