


Weighing The Financial Risks Of Peaches In Florida
 October 27, 2013
 Undertaking a new agricultural “adventure” and diversifying always includes new and added exposure to risks, such as understanding the cultural practices required to produce a high-quality product, how to handle the produce after harvest, and anticipating and correcting for market limitations.
Over the past 10 years, many enterprises have been successful with specialty crops in Florida, hitting a prime marketing window in early spring, delivering the first domestic fruit of the year with great economic success. For example, peach growers in the southeast have reported receiving approximately $0.80¢ per pound, while overall in the U.S., reported revenue to the grower has been around 65¢ per pound. However, Florida peach growers are receiving between $1.25 to $2.00 per pound because of our early — ripening varieties.
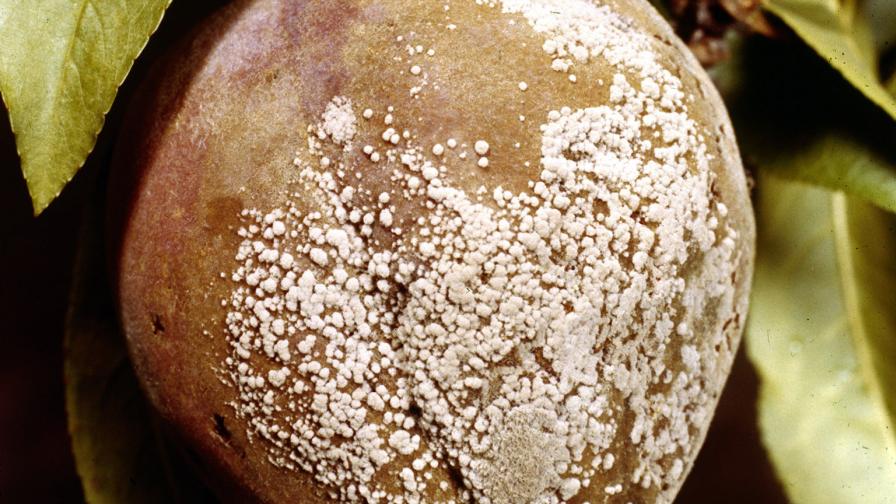
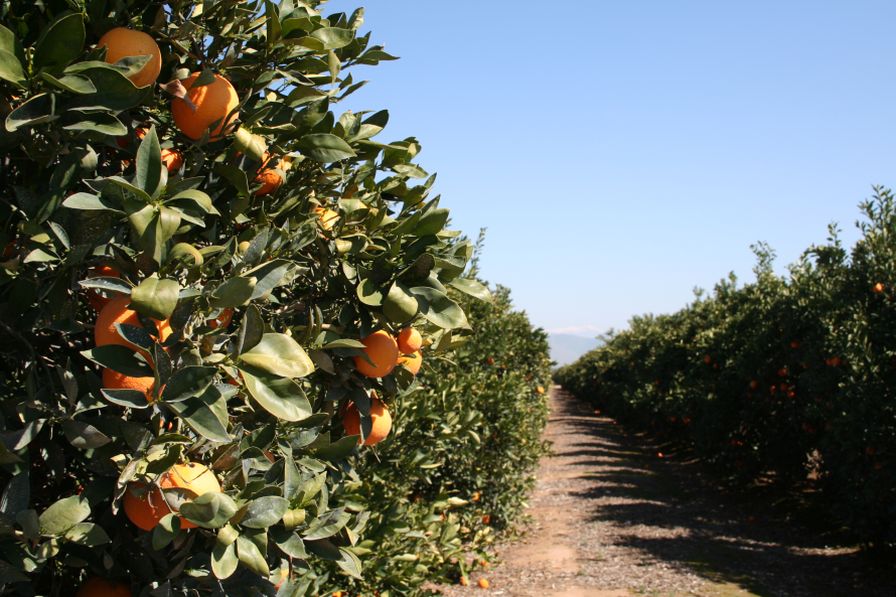
Growers wanting to diversify their operation and establish an orchard have had to depend on budgets that have been created for other states in the southeastern region (Morgan et al., 2010; Fonsah, 2007). The Florida grower experience is unique in that infrastructure is already in place with many citrus groves being converted to orchards, tree costs are relatively higher due to the cost of ‘Flordaguard’ rootstock, and there are fewer, if any, fungicide sprays available to successfully manage losses due to brown rot which has been prevalent in many seasons.
Recently, we published an Extension publication (Olmstead and Morgan, 2013) and a downloadable MS Excel- based budgets that help growers to determine establishment and subsequent production costs from years one through four, at which the tree is considered mature. The initial drafts of these budgets were developed with growers and those involved provided helpful comments, which helped to shape the final product.
These budgets were created based on key assumptions, including an average tree density of 117 trees per acre (15 x 25 foot spacing), an open vase training system, and early maturing varieties, such as TropicBeauty, UFSun, and UFBest. Growers can adjust these variables in the MS Excel spreadsheets provided online to tailor their current or potential operation. When costs, yields, or revenues are changed in the spreadsheet, graphs on the last two tabs of the spreadsheet are automatically updated. Cost lists for chemicals and other inputs were based on 2013 prices, and we anticipate that these will be updated every two years.
Although the marketable yield, market conditions, and input costs will vary each year, a summary table and graph based on revenues and costs can be determined (Olmstead and Morgan, 2013). In addition, because the farm gate values vary depending on the harvest date, fruit size, and variety, a sensitivity analysis is also provided in the extension publication.
Subscribe Today For