


New Climate Indicators Tool To Help Farmers Stay Weather Aware
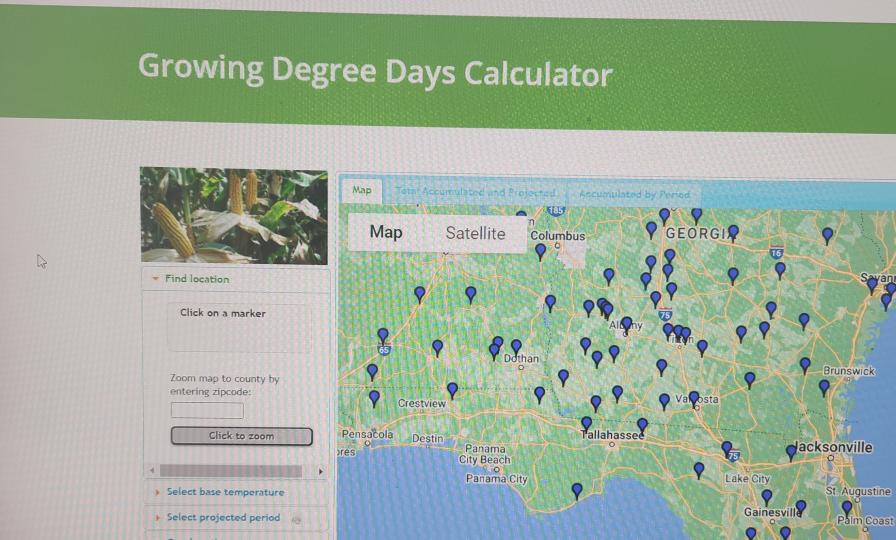
The Growing Days Calculator is just one feature of the new Climate Indicators tool on AgroClimate.org.
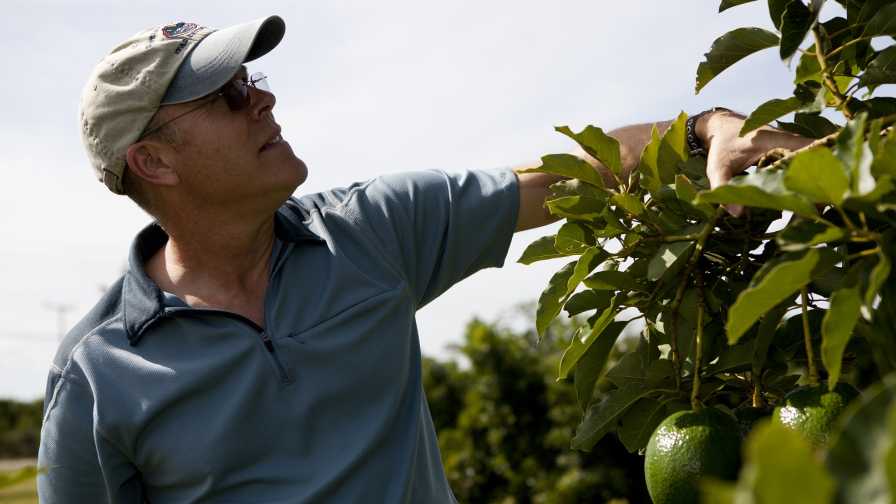
Photo by Brad Buck, UF/IFAS
A new University of Florida-developed web-based tool will help growers reduce risks that come with climate variability. Named the “Climate Indicators tool,” it’s the newest addition to AgroClimate, a web-based platform designed 15 years ago by Clyde Fraisse, a UF/IFAS Professor of agricultural and biological engineering.
Growers can use the Climate Indicators tool to track weather conditions and indicators in places where there isn’t a weather station in the vicinity of their farm, Fraisse says. It’s designed to help agricultural producers in Florida and around the world.
“The potential impacts of weather on agriculture can be better understood when typical meteorological variables such as precipitation and temperature are translated into measures that can better help us understand the effects of climate on crop development and yield,” Fraisse adds.
Some other things the Climate Indicator tool tracks:
• Growing-degree days, also called “heat units.” These are based on the fact that a plant develops only when the average temperature exceeds a base temperature. This can help growers track if crops are developing faster or slower and when certain critical development phases are reached.

• Chill accumulation – Plants need cool temperatures when they’re dormant in the winter so they can resume normal growth in the spring. Scientists call this exposure a “chilling accumulation requirement.”
• Temperature-humidity index – the combination of air temperature and humidity that can help quantify heat stress in livestock.
The module can also tell users about climate anomalies, such as the fact that daily minimum temperatures in Florida have been above normal during the last eight to 10 years — a trend that most likely will lower the yield of certain crops.
Additionally, the new tool lets growers track current weather conditions up to the previous day and also compare current observations — for instance, amount of rainfall in the last 15 days — to the historical observations for the same period during the last 40 years.
For more, continue reading at blogs.ifas.ufl.edu.
Subscribe Today For