


Revealing the Virtues of Precision Viticulture
 November 3, 2020
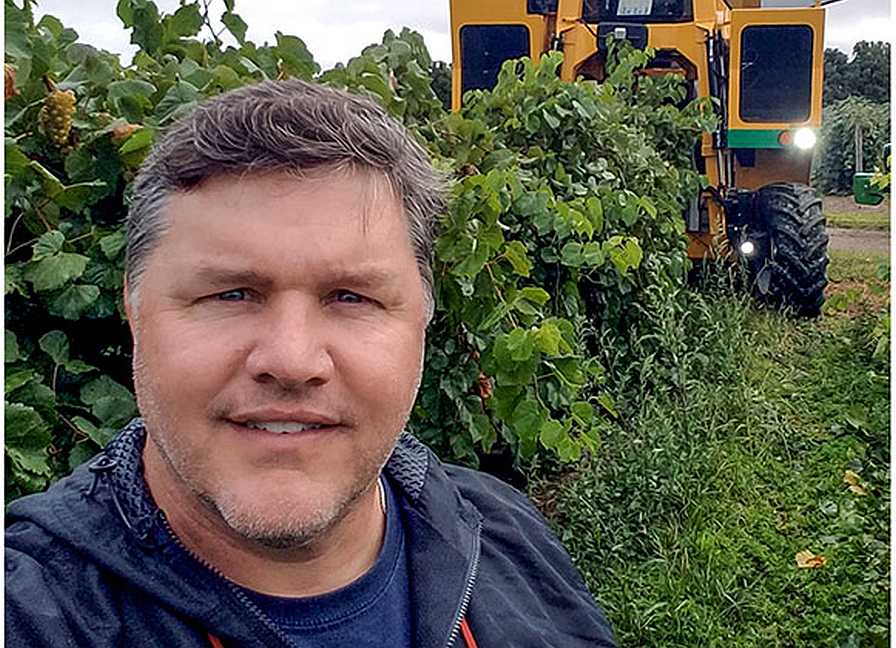
Terry Bates leads the Efficient Vineyard project while serving as the Director of the Cornell Lake Erie Research and Extension Laboratory in Portland, NY.
Photo courtesy of Cornell University
As a pioneer of precision technology in the field of viticulture, Terry Bates hears it all the time from data-fearing growers.
“I have all of this information and all of these pretty maps sitting on my desk. I don’t know what to do with it.”
In the end, Bates tells growers exactly what they can do with that information to better manage vineyard crop load. But not before he dishes out some cool-looking spatial data of his own. Especially vivid these days are aerial images of one of the research blocks at the Cornell Lake Erie Research and Extension Laboratory (CLEREL), where Bates is the Director.
On May 27, the CLEREL team used variable-rate mechanical shoot thinning to alter the shoot density of select ‘Concord’ vines across the research block. In the process, they designed a visible letter “C” that covers 4 acres of the Portland, NY, property.
“Instead of a crop circle, we wanted to make a big Cornell ‘C’ in the middle of the field,” Bates says.
Today, the now-harvested block serves as the bigger-than-life trademark of the Efficient Vineyard project that Bates conceived in 2011. The goal of the undertaking, which marked its first harvest in 2016, is to advance the use of precision viticulture in wine, juice, and table grape production across the U.S.
The Big C trial, which used proximal NDVI (normalized difference vegetation index) sensors at bloom to detect shoot density, illustrates the potential of using prescription maps and variable-rate mechanization of shoot and crop thinning to manage variability in commercial vineyards.
“We wanted uniform low shoot count inside the ‘C’ and uniform high shoot count outside of the ‘C,’” Bates says. “We knew that the shoot density was variable across the field based on the original NDVI. So, we had to do variable-rate, less thinning outside the ‘C’ and more thinning inside the ‘C.’ But we also knew that shoot count was variable inside and outside, so it was like variable rate on top of variable rate to get what we wanted.”
Will growers better understand the process now? “The Big C is about the demonstration of the technology,” Bates says. “If we can make a Big C in the middle of a field, just think about what you can do with your own management.”
So, how should growers execute the Efficient Vineyard game plan? Bates breaks it down:
Start with a clear vine management objective: It all begins, he says, with growers knowing what they want to measure or what they want to manage. Then, what data do they need, and how are they going to go after that data?
“That’s the first thing we always say in science, too,” Bates says. “If someone wants to write a research paper, it’s like, what’s your hypothesis? What’s your question that you’re trying to answer? It’s the same thing with growers. What is it you’d like to manage?”
As Bates often stresses, every grower is unique. For example, CLEREL’s work in Western New York is specific to ‘Concord’ grapes while catering to the juice industry.
“In our particular project, the juice grape guys — my guys — they’re all about crop management in terms of, ‘I need more crop, and I want to take some off, and I want to be able to fine-tune that,” Bates says. “Meanwhile, the wine grape guys in California are really hot on yield estimation. ‘How can we use the data to get better yield estimation?’ And then the table grape guys are really interested in fruit and color development after veraison to harvest. Everyone has their management twists.”
Use a “sensor” to collect spatial vineyard data: Bates accompanies the word with quote marks because a sensor, he says, could simply be a human being going out and looking at a vine and rating it for disease. Meanwhile, growers, he adds, “get hung up on” wondering if a sensor should be attached to a tractor or put on a drone or a satellite in space.
“The point is it’s not the vehicle that is important,” Bates says. “It’s the sensor, what it’s measuring, and how well can you validate it as a viticulture measurement.”
CLEREL primarily uses proximal sensors, Bates says, meaning it mounts them on tractors and all-terrain vehicles or drags soil sensors along the ground.
“We have mainly stayed away from drones and satellites, although we’re starting to work with those now,” Bates says. “We started (with proximal sensors) because it was the cheapest, most accessible option we had at the time.
“We also find (this) to be our most accurate, reliable measurement of NDVI. When you fly it on a drone, the canopy saturates that sense, and you can’t pick up those subtle differences of vines being big or small. The same thing with satellite.”
Translate sensor data to viticulture information: With high-density sensor data, spatial maps can be used to direct manual samples to regions of high, medium, and low sensor signals in a stratified sampling protocol. The relationship between the high-density sensor signal and the low-density viticulture measurements can be used to generate a high-density viticulture map.
“The sensor is just an electronic signal,” Bates says. “So, if an NDVI is 0.5, what does that tell you? I have no idea. But if I know my relationship between NDVI and canopy fill, I can then say, ‘Oh, I know an NDVI of 0.5 is 70% canopy fill.”
Variable-rate mechanization: Once growers have their data in hand and have made a viticulture decision, they will want to make a prescription map and apply variable-rate management.
“You could be handing a person a prescription map on their smart phone, and as they walk through the vineyard, they’re doing what you want them to be doing,” Bates says. “You’re pruning to a higher bud level or a lower bud level, and they’re just looking on their smart phones saying, ‘Oh, I’m in a high zone. I have to leave more buds here.’ Or, ‘I’m in a low zone, and the boss wants me to leave fewer buds here during pruning.’ Or it can be a fully integrated machine, where you’ve got a prescription map, and you’re feeding the computer, the computer is controlling the hydraulics, the hydraulics is controlling the implement, and the implement is doing what you want it to do. It’s scalable.”
Evaluation of variable-rate shoot thinning: Did the grower accomplish what he or she wanted to accomplish?
“You think it’s intuitive, but there’s so many people that drop the ball on that last step,” Bates says. “I did all this work, I collected all this data, I made my decisions, I came up with a prescription map and did the management — and then I didn’t actually measure if I did anything. That’s where the yield monitor on a harvester and the Brix monitor come into play. We did all this management. What’s the impact? Am I getting more uniform or higher quality fruit? Am I shooting for higher yields? Have I evaluated the impact of my management?”
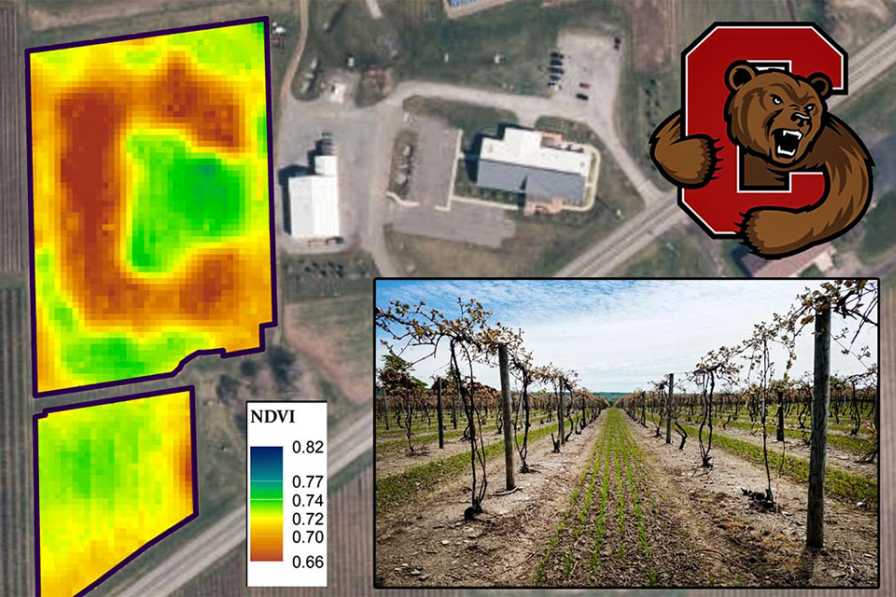
Designed to illustrate the application of variable-rate mechanical shoot thinning in ‘Concord’ grapes, the CLEREL team designed a 4-acre Cornell C on one of its vineyards, which were treated with variable-rate mechanical shoot thinning (inset) on May 27.
Photo courtesy of Cornell University
Speaking of Evaluation
Between May 27 and harvest in late September, CLEREL’s once-distinct “C” disappeared — a testament to successful variable-rate mechanical shoot thinning.
“By the middle of the season, that ‘C’ washes out,” Bates says. “You don’t see it anymore because the vines with 40 shoots, those shoots are longer and have bigger leaves, and the vines with 80 shoots on them, those shoots are smaller. So, when the NDVI — the scanner — goes through, it basically is just seeing a full canopy in both situations.”
This is where it gets “really interesting,” Bates adds. “We just harvested that block with a mechanical harvester that has a yield monitor on it and a Brix monitor on it that we developed at Cornell. You can now see the ‘C’ again in the yield, where the yield is lower inside the ‘C’ than outside.”
And that is the whole point with the ‘Concord’ industry and shoot thinning, Bates says. “We’re trying to adjust crop size. You leave more buds than we need. If we get past the spring frost, we can do some shoot thinning to bring the crop down so the vine isn’t overcropped. And then we can even do that with fruit thinning later,” he says.
“So, we wanted to show, ‘Yes, I use mechanical shoot thinning, I use it variable rate, it knocks my crop down to where I want it to, and it should show up in the yield monitor.’ And it did. I don’t have that map made yet, but as we were looking at the map in the cab of the harvester, we’re, like, ‘There it is! There’s the ‘C!’”
Subscribe Today For