


Can Virtual Sensors Save California’s At-Risk Almond Yields?
 April 26, 2018
 It goes without saying that growers must do whatever they can to mitigate risks to their crops. Some things like extreme weather, however, are simply beyond the control of even the best farm management practices. The game could be changing though thanks to rapidly developing agriculture technology and virtual sensors.
When a weather event threatens the emerging almond crop in Central California, it’s bound to make headlines. From the morning of February 20, an upper-level trough remained almost stationary across the western U.S. throughout the week, with waves of unseasonably cold air settling into the region, the worst of which occurred on the mornings of February 20 and 24. In the wake of the migrating disturbances moving through the trough, surface high pressure settled in on those two particular mornings, resulting in dry air, light winds, and stable conditions. As most almond growers will tell you, these conditions all but guarantee freezing temperatures at a truly inopportune time in the almond growth cycle.
Freezing in February
According to Blue Diamond grower reports, most varieties were already at 40% or greater bloom during this particular freeze event. It’s generally understood nut damage can begin with as little as 30 minutes of exposure to temperatures of 29°F or less during the full bloom and nut stages. On the extreme end of the scale, one of the California Irrigation Management Service (CIMIS) stations near Oakdale dropped as low as 19°F on the morning of February 20, indicating how significant a threat this day posed.
With conditions like this, forward-looking growers cleverly ran sprinklers to combat the effects of the cold temperatures. Others will have used wind machines or even flown helicopters over threatened orchards. Given the labor and time involved with these activities, an orchard-specific temperature data source leading up to the event is essential for properly executing the right activities at the right time and location.
Gaps in the Data
On a 40-acre almond plot, a 10% reduction of almond yield could amount to as much as a $16k loss. With such sizeable losses in revenue, almond growers especially cannot afford to risk damage to their valuable crop. So, in the case of February 20, what were their options? For those who had access to localized weather station data alerting them to run their sprinklers, they were probably able to mitigate the damage. But how about those who maybe didn’t have a weather station onsite and relied on publicly available sources?
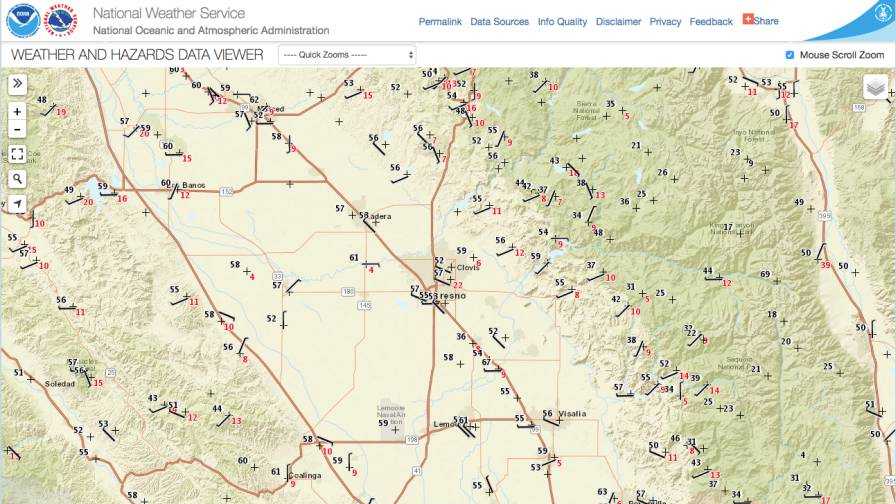
This map shows the various publicly available surface weather stations in Central California centered near Fresno. While data points appear plentiful, there are still gaps. The use of supplemental virtual sensors might help bridge the gaps.
Image courtesy of NOAA
Each of the arrows in the map above indicates a location where surface temperature is being recorded. However, if you consider the size of an almond orchard, you can see where large distances might exist between a grower’s orchard and a surface observation in the central valley. There also is the issue of whether any distant weather station is even representative of your location since terrain features and other factors may mitigate the usefulness of such data. So, what can you do if you would like current conditions and a short-term forecast for one of these gapped regions?
![]() One solution would be to install your own weather station while searching out a weather forecast for that location. Surface weather stations have come very far in instrumentation improvements over the years, but they still cannot forecast weather, nor will they as they are observing systems, not forecast systems. To get the whole picture, you will need to combine observed and forecast data with the assumption that it is all representative of your location.
One solution would be to install your own weather station while searching out a weather forecast for that location. Surface weather stations have come very far in instrumentation improvements over the years, but they still cannot forecast weather, nor will they as they are observing systems, not forecast systems. To get the whole picture, you will need to combine observed and forecast data with the assumption that it is all representative of your location.
Another approach could be utilizing a network of virtual sensors that has both a historical record and a forecast component. You may already rely on virtual sensors every day. For instance, have you ever depended on a weather forecast from the National Weather Service?
So, what about those data holes that we pointed out previously? How do you even begin to make a forecast for those locations given that they do not have any starting point for data if it is indeed observations? The answer to this question can get fairly complex, so we will use a very basic example that is derived from a very old technique … For this and more, read the full feature at PrecisionAg.com.
Subscribe Today For