


Better Science Is On the Way To Help Forecast the Weather
 August 23, 2023
 It’s an age-old tale. Farmers make meticulous plans for the upcoming season, taking into account needed crop rotations, expected sales, labor, and some experimental fields. Everyone knows those plans have to be retooled as the season goes along, yet these game plans are the difference between a successful operation and one that sells off its land. But imagine if long-term weather forecasting improves to the point where you’ll know weather conditions up to a year in advance.
I know, I know. It sounds like a pipe dream. And that was my first thought when I read a Washington Post article about a new forecast tool that promises to do just that. Well, to a point. But I’m getting ahead of myself.
Several studies are underway, testing long-range forecasting overall weather patterns. To be clear, these are not predicting, say, a flash flood in mid-October in Yuma, AZ. Rather, it’s using improved understandings of ocean temperatures, currents, and atmospheric patterns to better understand how much rain will fall in a region up to a year advance.
Take one study from National Center for Atmospheric Research scientist Adreas Prein and his team. Adapting a European model to the U.S. Desert Southwest, Prein and the team reliably identified large-scale atmospheric moisture increases based on conditions in the Pacific Ocean and Gulf of Mexico several months ahead of time.
Since this research was from 2022, I dove into peer review journal articles on the topic. It was a relief to see the amount of work being done in this area worldwide. It looks like we’ll soon benefit from reliable long-term forecasting.
Naturally, there are limits. These models cannot predict exactly when or where thunderstorms will form. They show roughly when enough moisture will accumulate in a region and how much rainfall to expect in a month’s time.
Also, these studies are currently working on specific areas of the globe. The idea is that these models can become part of complex computer modeling that local meteorologists can use for their own areas.
But we’re not there yet.
This would be an amazing tool for planning a growing season. How many planted acres were abandoned in 2021 and 2022 due to the drought and limited water resources? If those growers knew those conditions were heading their way, they could have focused on improving soil conditions in fallow fields rather than losing the costs of preparing, planting, and cultivating fields they’d later need to walk away from.
We live in unpredictable, stressful times. But the quality of research taking place heartens me.
Oh, One More Thing
Intense rain patterns are increasing, as these graphics from EPA and the National Ocean and Atmospheric Administration (NOAA) show.
Rain Anomalies
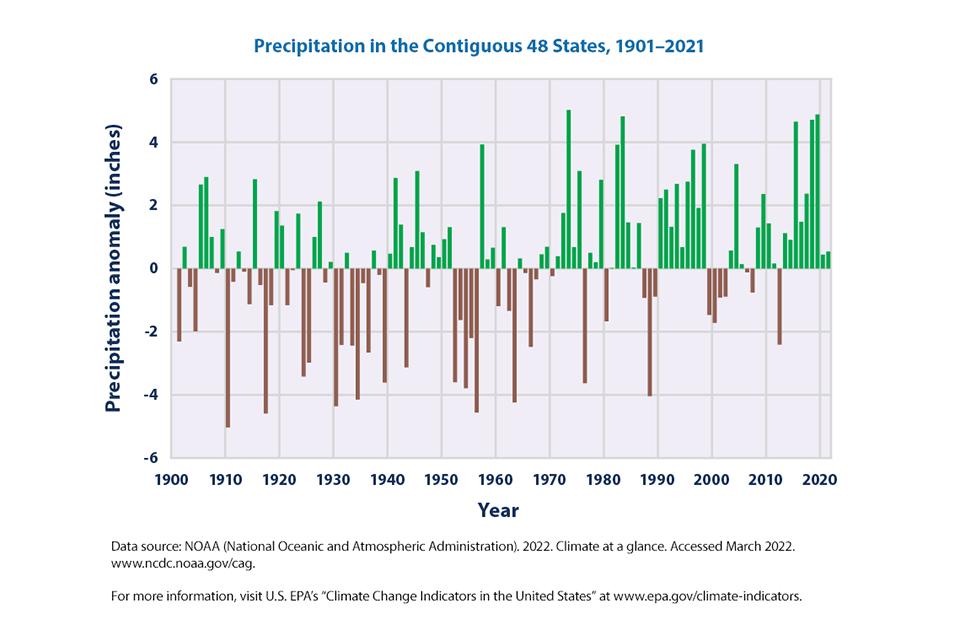
Pay attention to when deficits and increases take place. You’ll easily see the Dust Bown era, as well as the 1950s drought. And take note of the increasing rainfall in the past 10 years. This displays national averages, so the extensive drought in much of the West factors into these numbers.
More Areas Affected
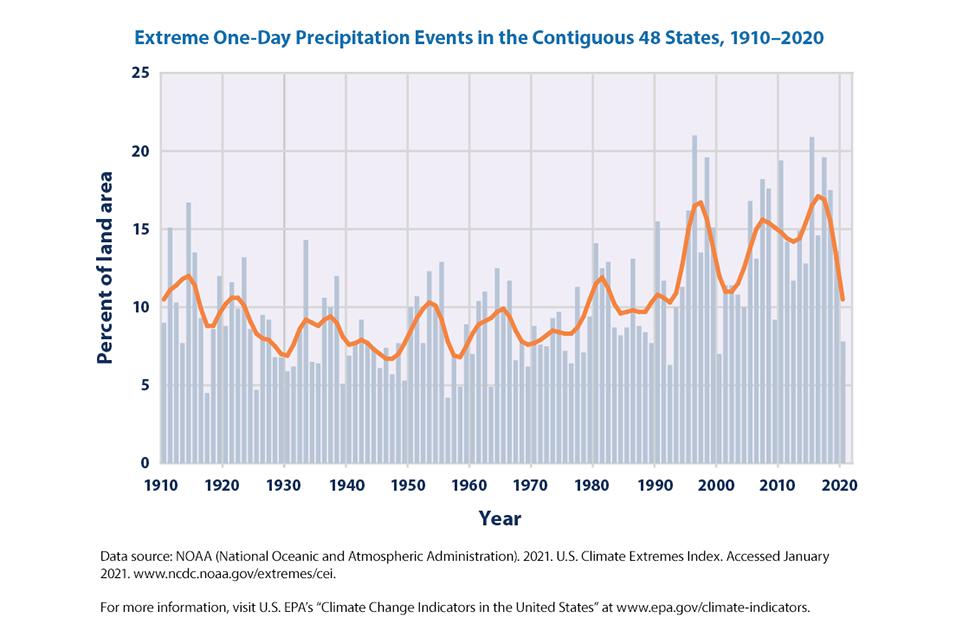
Extreme one-day events are not only on the increase, they’re happening in more areas not normally affected. In recent years, more than 20% of the landmass of the contiguous 48 states had an extreme event in the same year.
Localized Trends
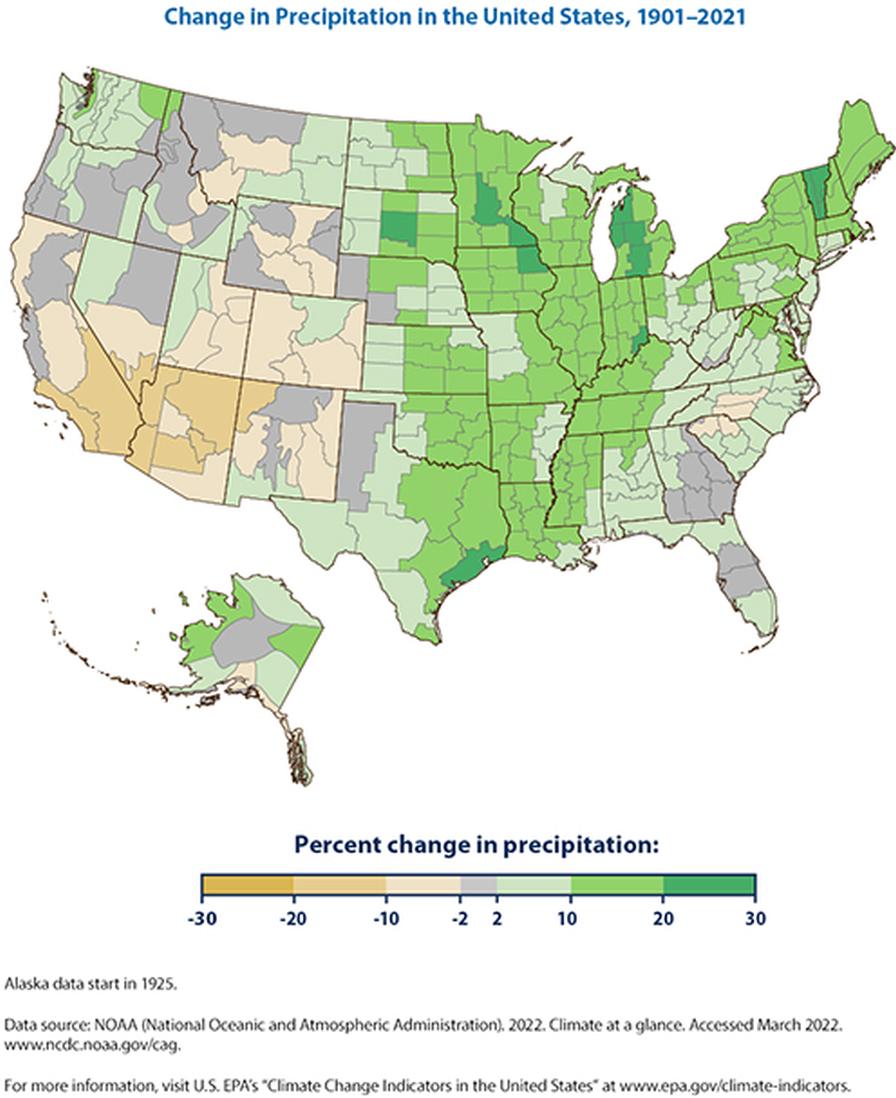
As you can see, increases and decreases in rainfall in the past 100 years vary. Many growing areas saw an almost 30% rainfall increase, which Yuma and the Imperial Valley saw an equivalent decrease.
Subscribe Today For