


How COVID-19 Is Changing Vegetable Crop Plans for 2020
 April 15, 2020
 Our team had unexpected insight to how the COVID-19 pandemic is affecting vegetable production decision making. It’s all due to the timing of when we conducted our State of the Vegetable Industry Survey: February and March 2020.
Slightly more than half our responses came in the later half of March. This allowed us to compare the responses before and after the first stay-at-home orders occurred (March 13). That’s when food service produce sales plummeted.
We zeroed in on one particular question in the Survey: Which crops you plan to grow this season?
It’s a monster question, one survey takers likely groan at when they reach it. For each of the 32 crops, we ask:
In 2020, are you:
- Adding the crop
- Increasing production
- Staying the same
- Decreasing production
- Dropping the crop
We also have an option for not growing the crop.
Overall, 624 people took the State of the Vegetable Industry survey, including 510 growers.
So here’s what we learned when we took a look at how plans for crops changed before and after COVID-19 took a grip on the produce industry.
Growers Grew Cautious After March 13
Overall, growers pulled back on making big changes.
Those planning to add a crop to the mix in 2020 decided to hold off. Those planning to increase production on a crop retrenched. And even those planning to drop a crop in 2020 had second thoughts.
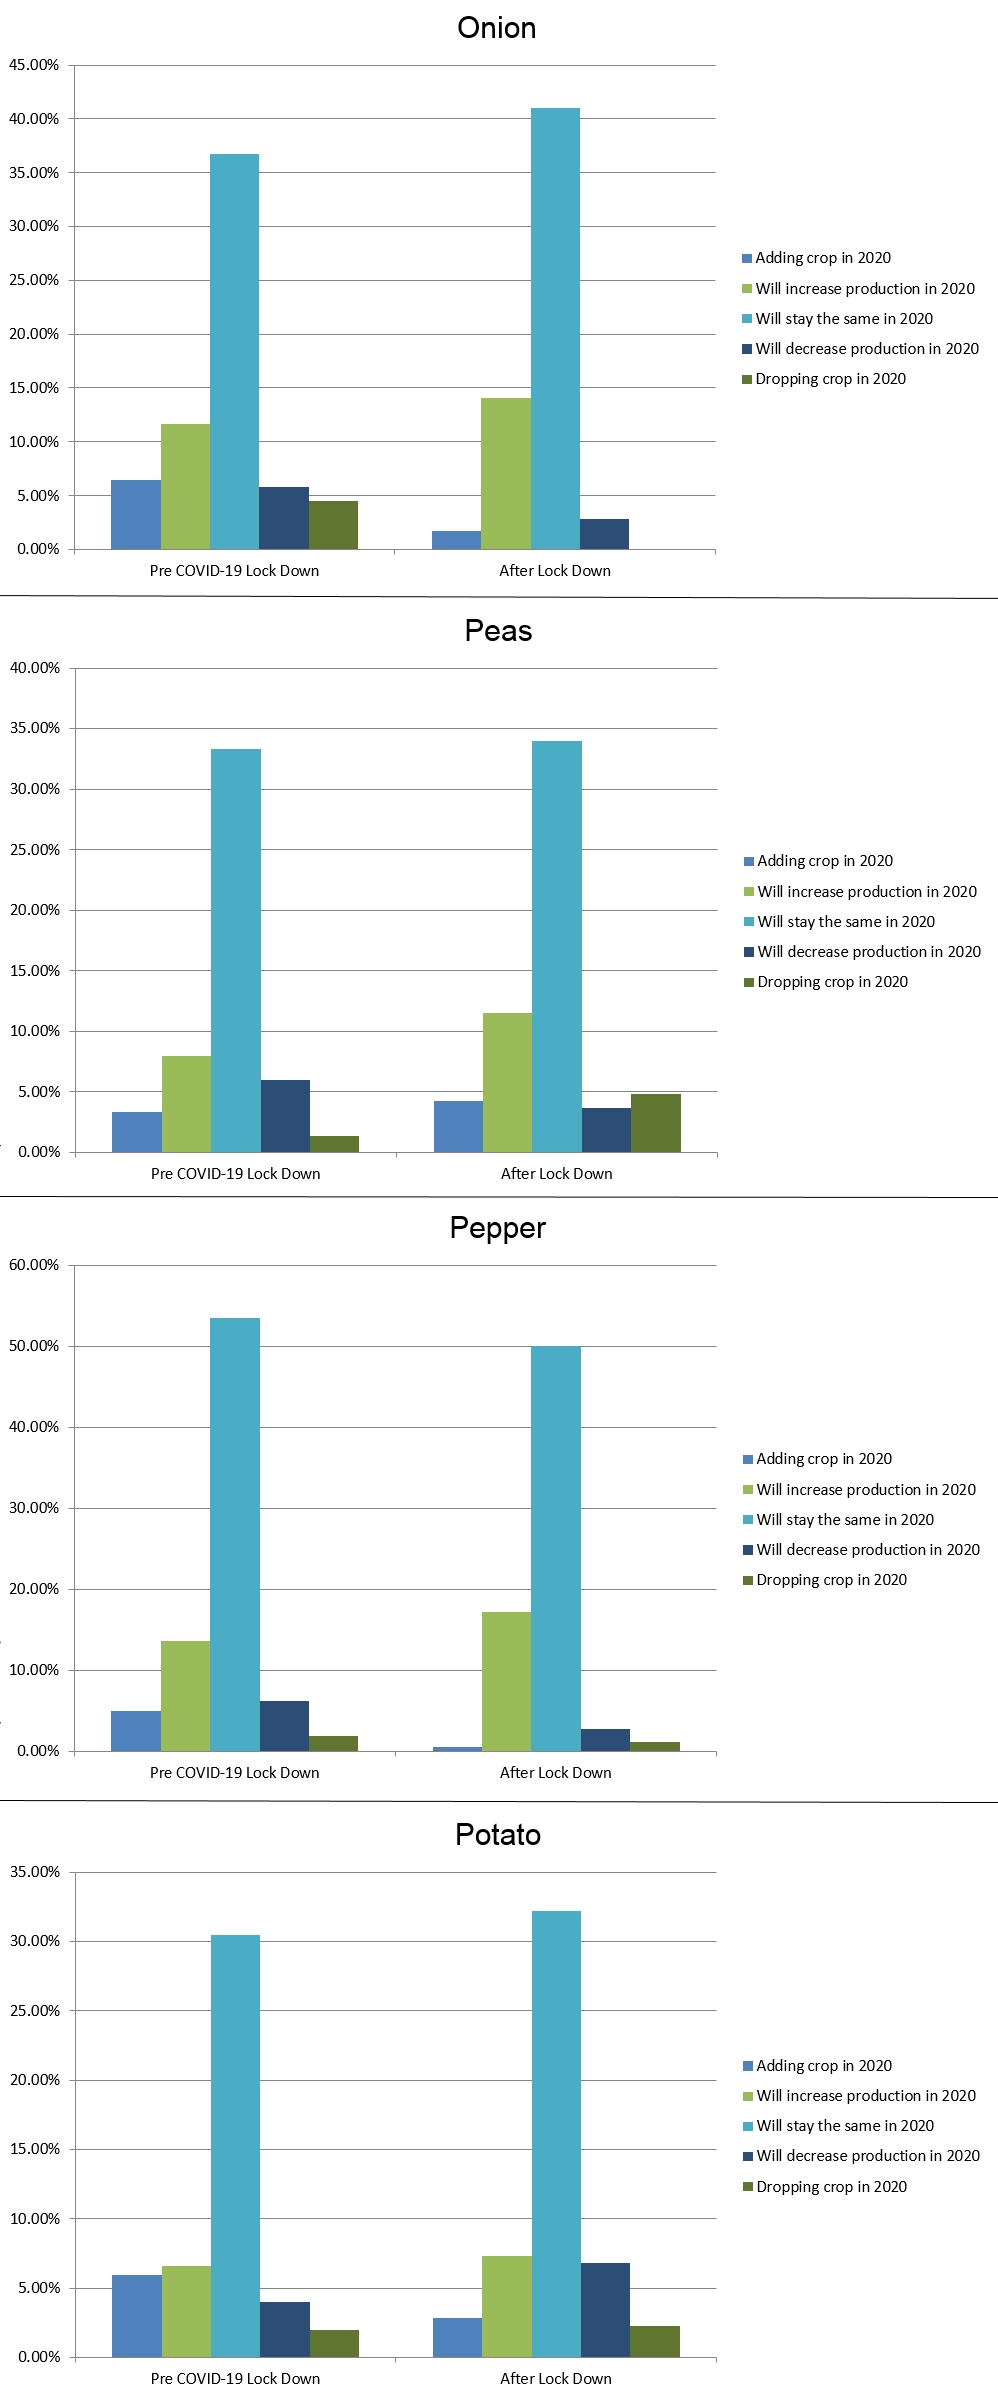
Naturally some crops bucked the trends. More growers answering after the stay-at-home order plan to increase onions (11.6% to 14%) and peas (8% to 11.5%) crops than their peers responding prior to the order.
The one area with mixed responses related to plans for decreasing production for a crop.
Growers responding after COVID-19 impacted food service accelerated their plans to decrease production on roughly a third of the 33 vegetable crops we asked about. But they also halted plans to decrease production on slightly more than a third of crops. The remaining crops saw no changes in plans.
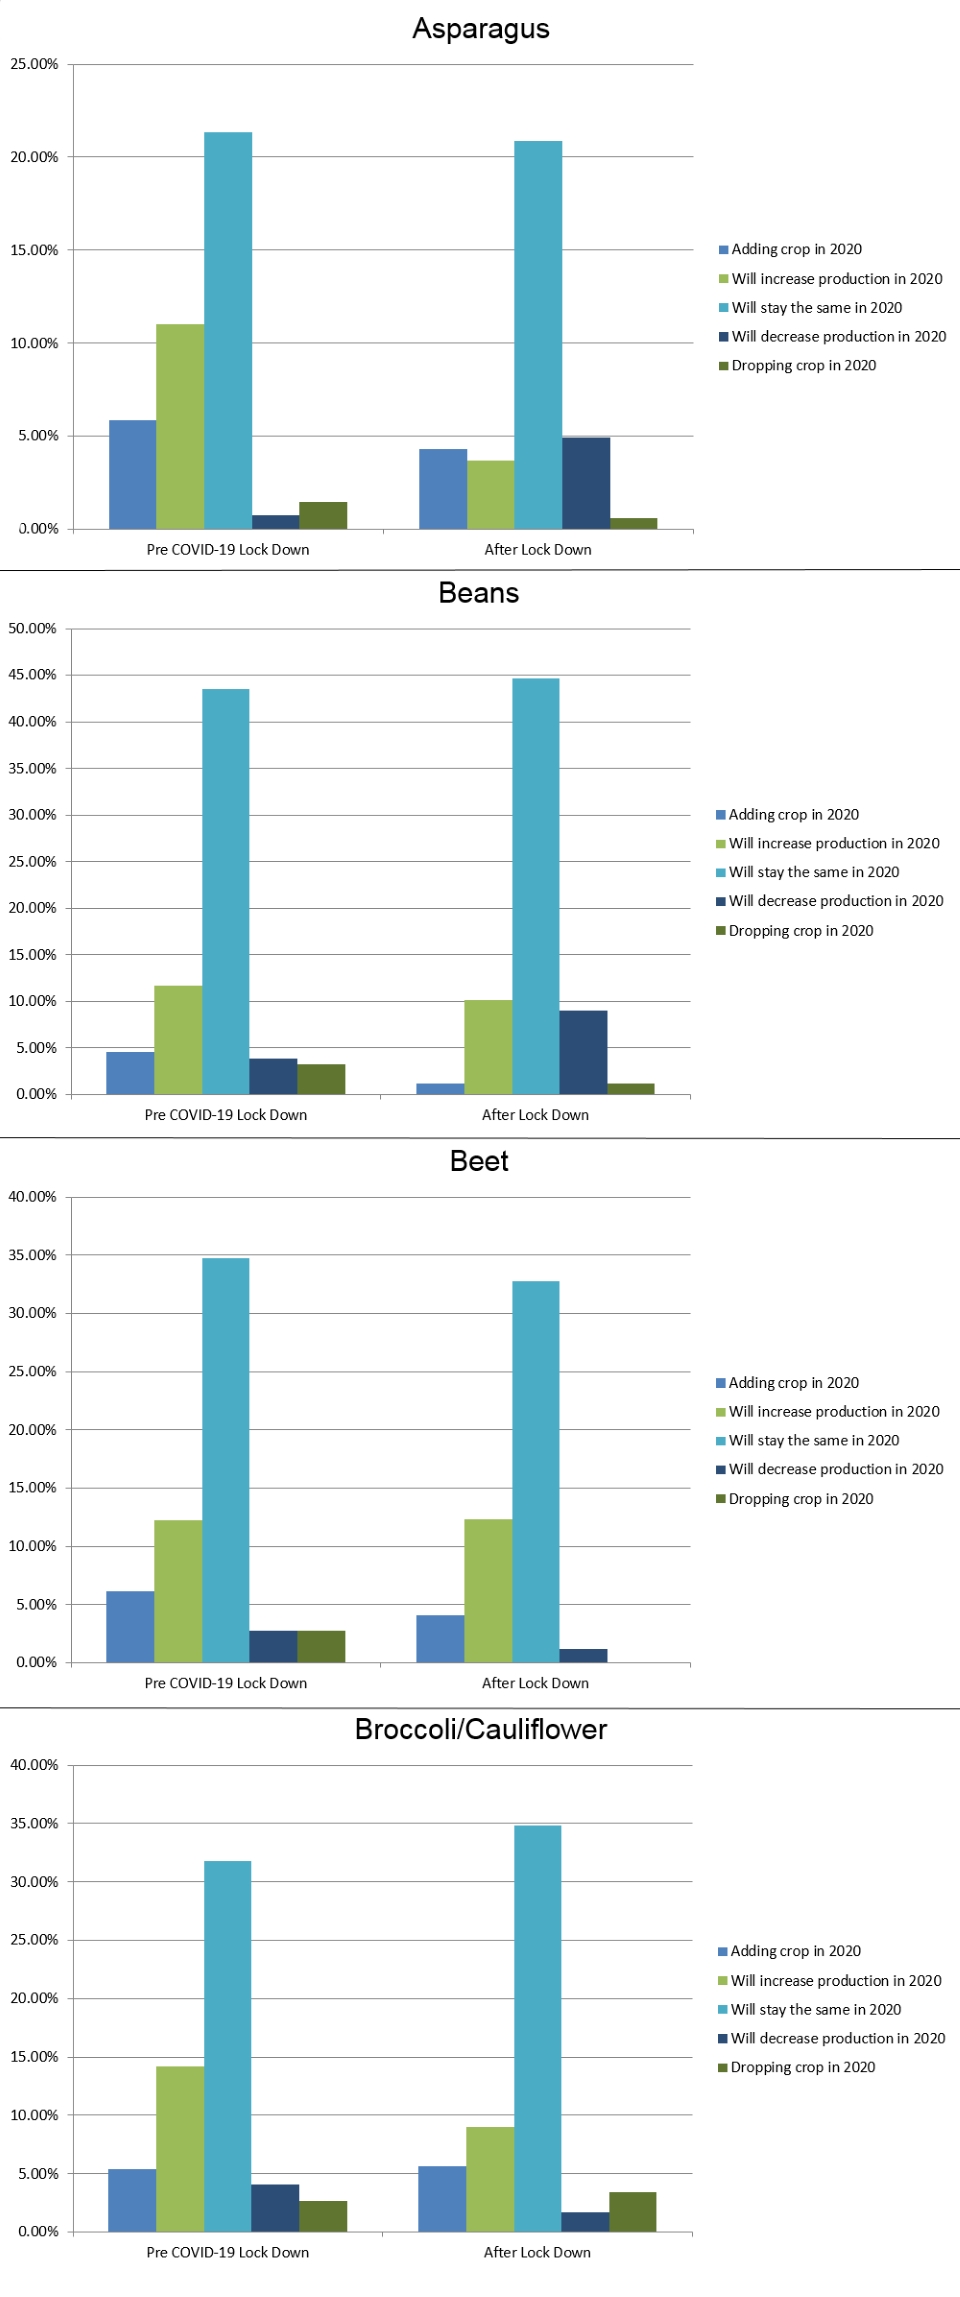
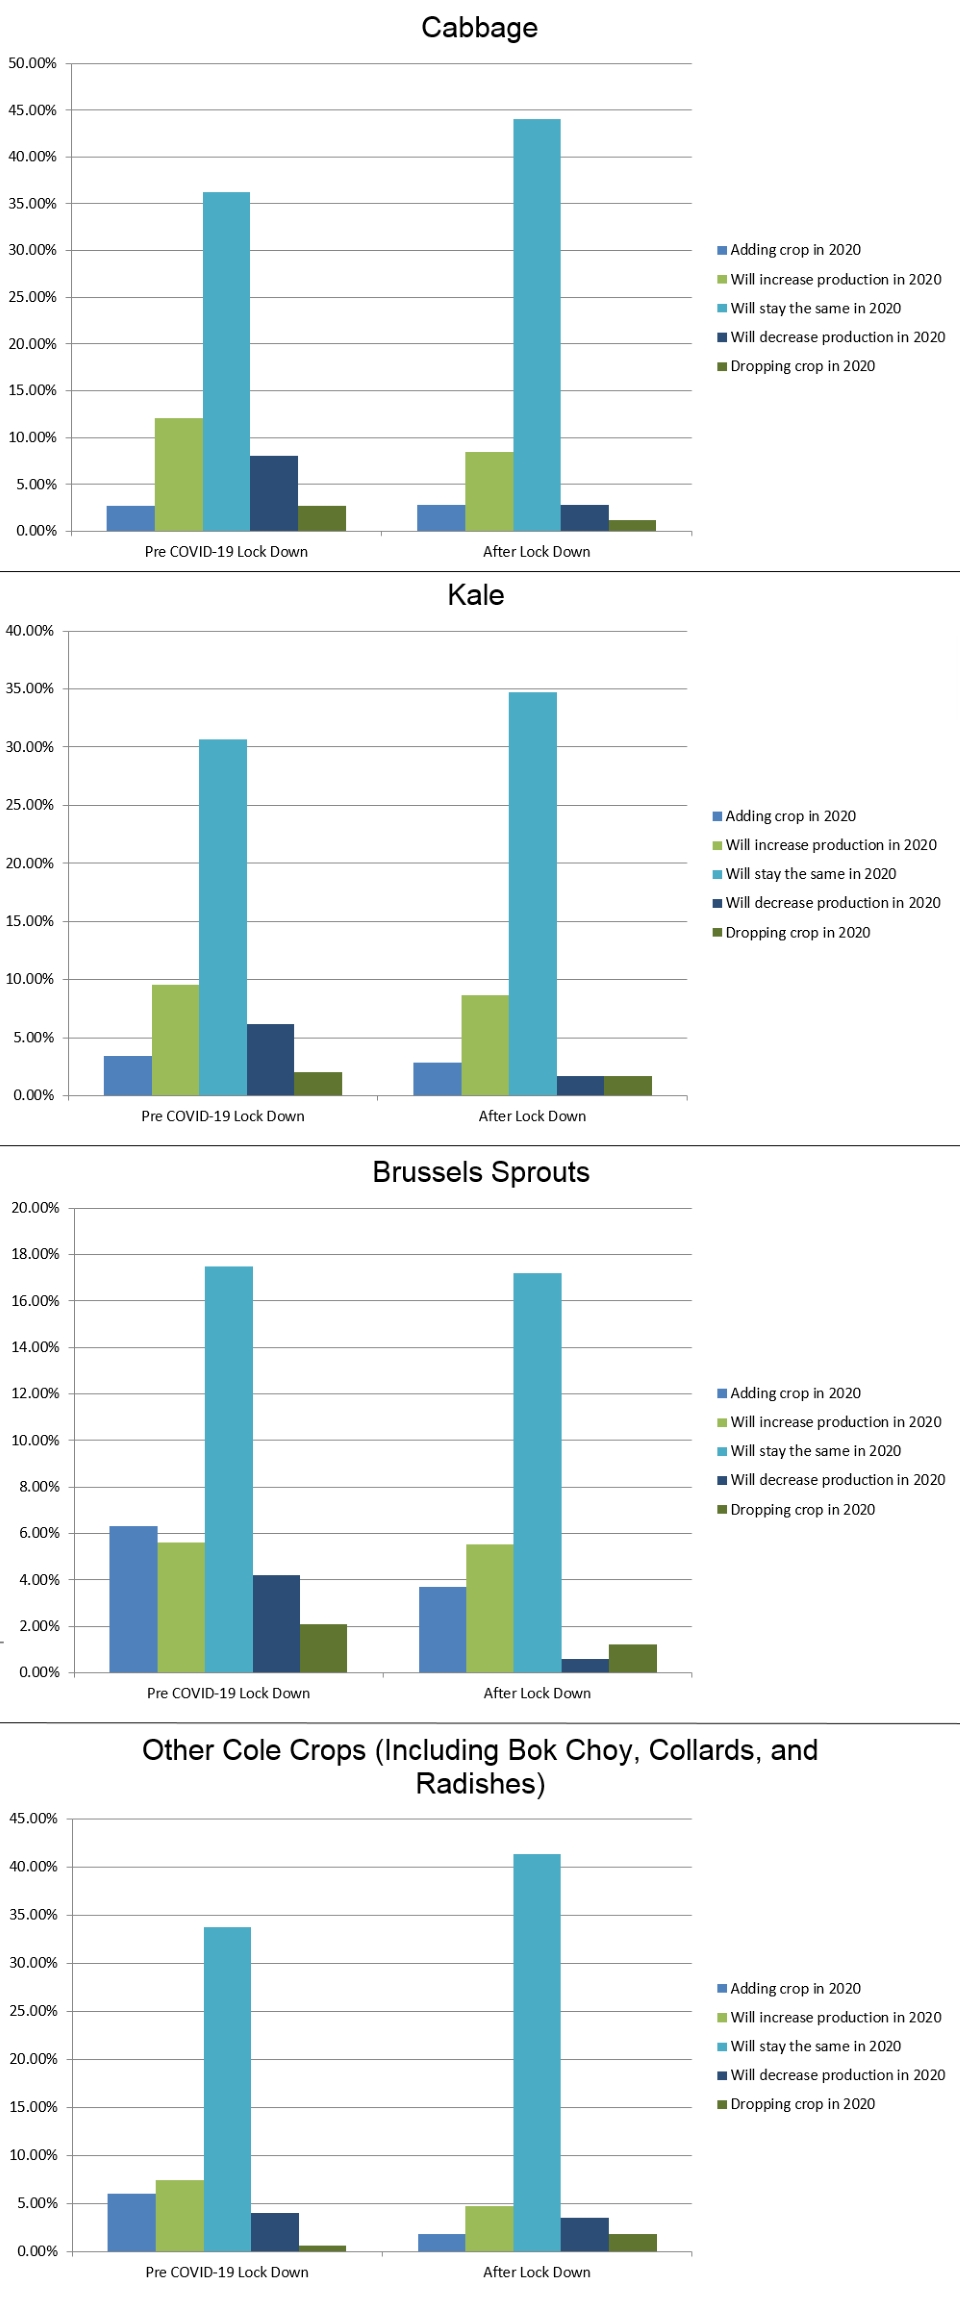
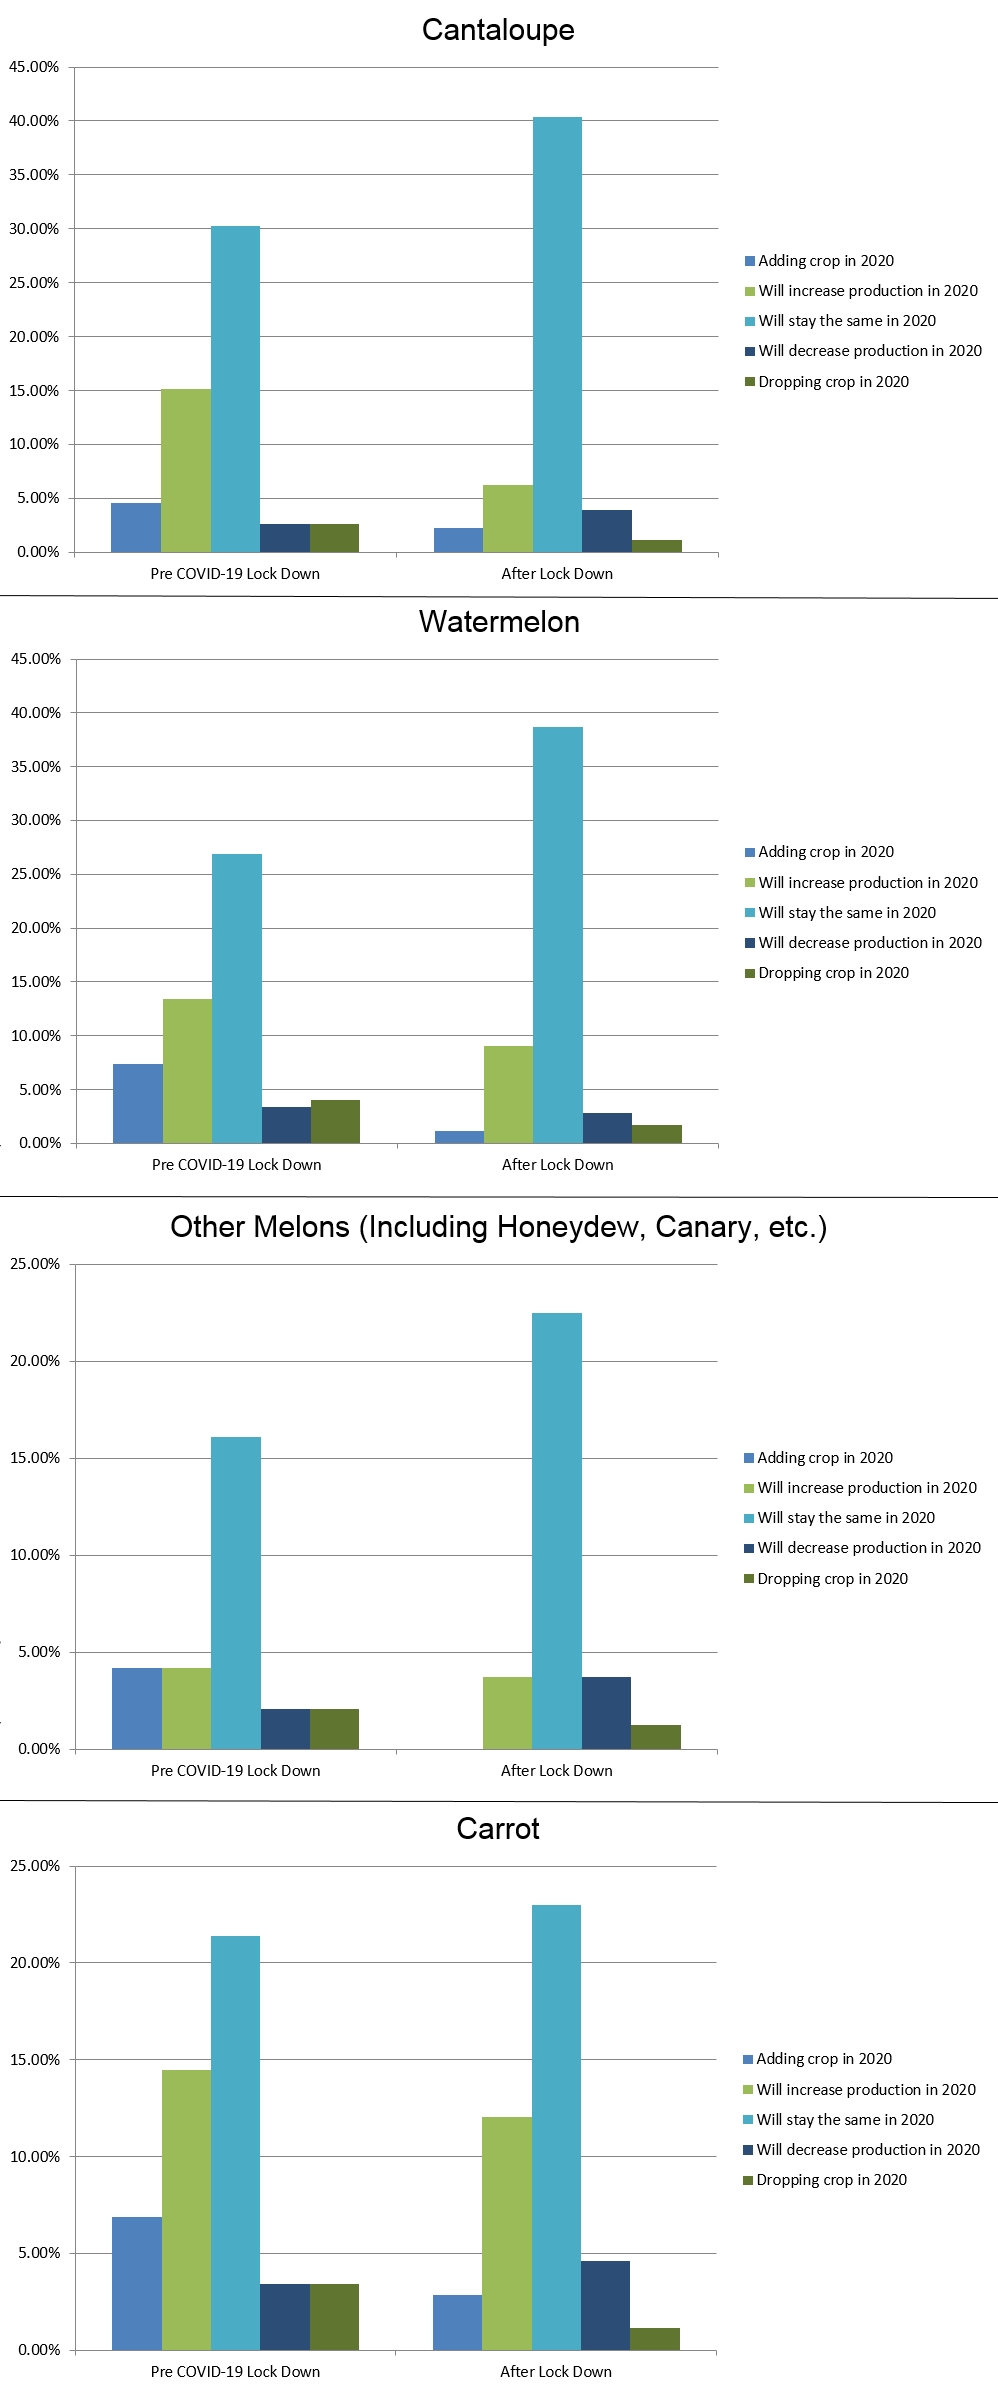
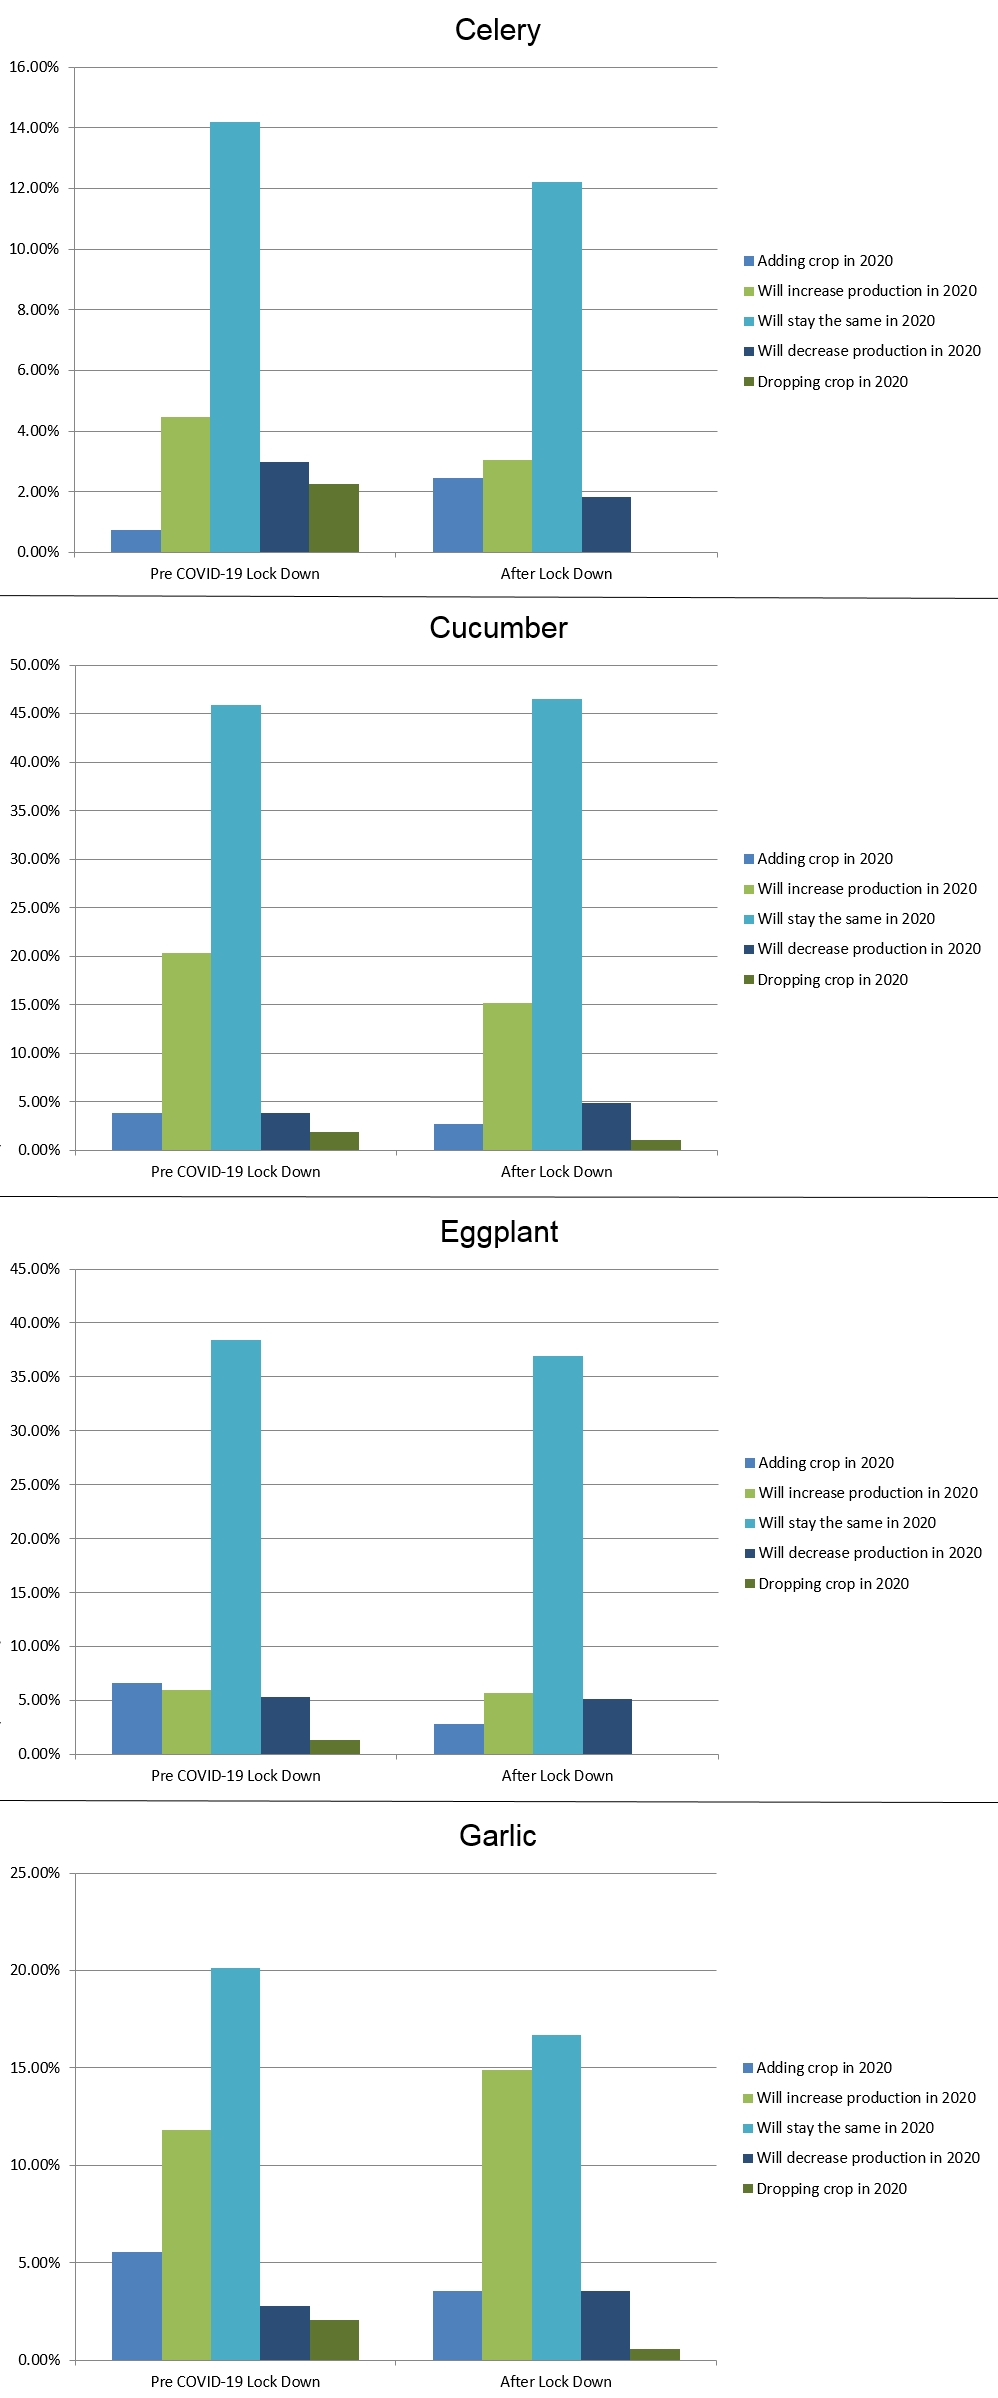
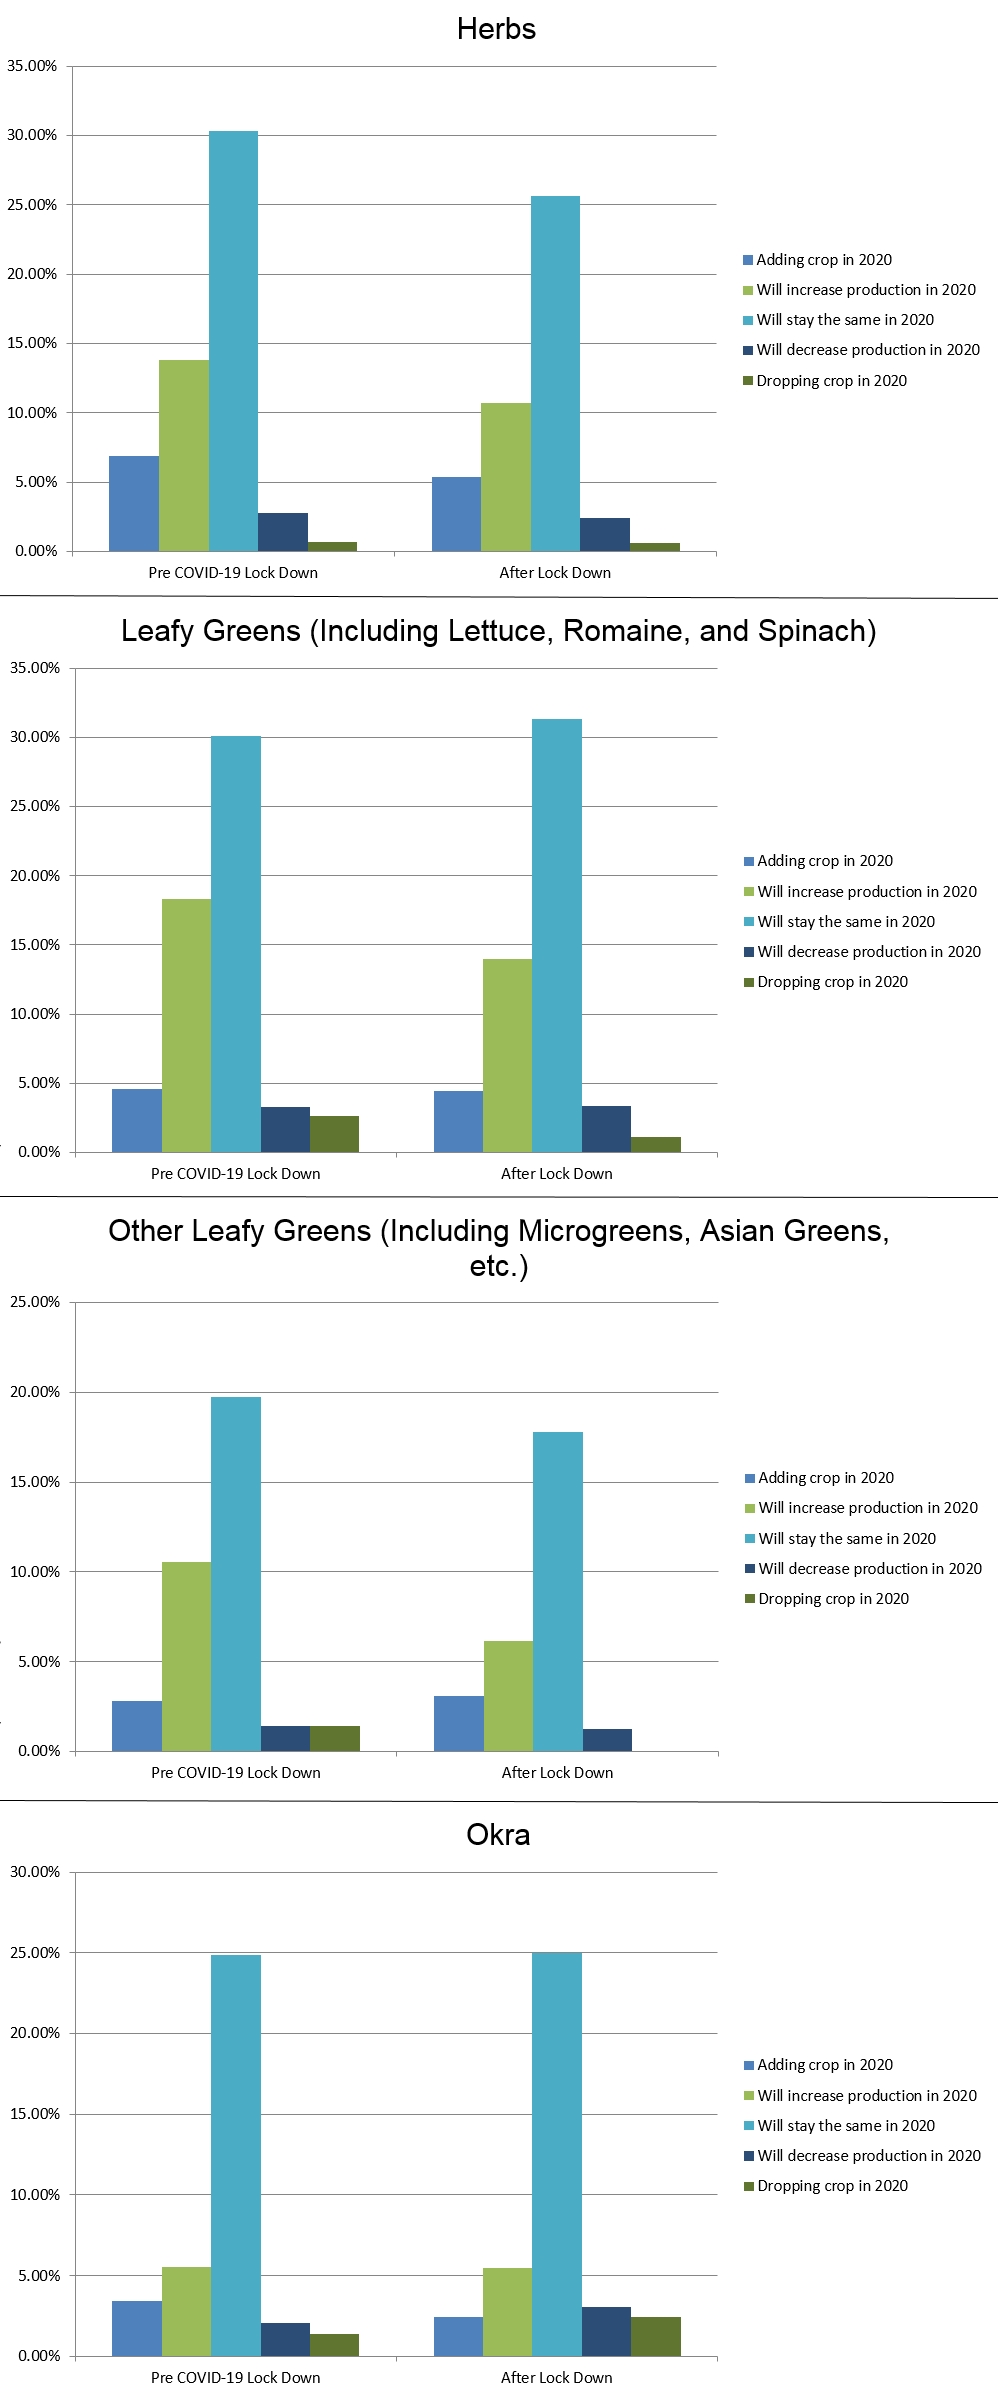
Here’s a Look at Individual Crops
These charts compares the responses growers gave to all 32 crops, sorted by pre-lock down and after the lock down. Note that the percentages do not add up to 100%. The missing amount represents those who do not grow the crop.
Subscribe Today For