Where You Can Sell Your Leftover Crops
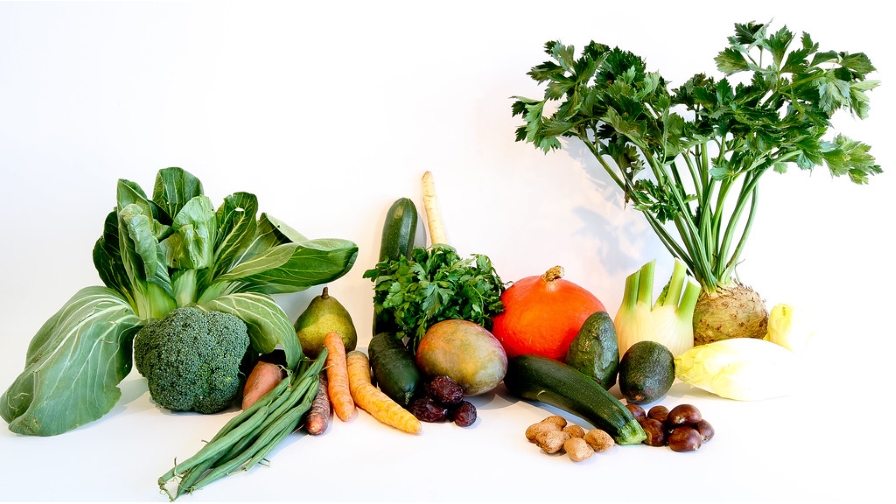 The U.S. wastes an estimated 40% of its food, according to a study (Gunders et al., 2017). And that figure doesn’t include on-farm food losses. Estimates like this have led to movement to reverse the trend. People across the supply chain are finding ways to measure food waste, understand what causes the waste, and devising waste-prevention strategies.
To date, a majority of food-waste studies focus on post-consumer waste. To a lesser extent, they study waste in food distribution and retail settings.
Very little attention has been given to understanding food loss at the farm level.
What About On-Farm Waste?
It’s important to measure how much food never leaves the field — and its value. We’ve written an article on why that’s important and how to measure what’s left behind after harvest, so we will move on to the obvious next step. If you have edible or marketable leftover crops, where do you find buyers? And will those buyers pay you enough to make scheduling another harvest worth it?
Let’s explore the costs and potential revenue that you could generate from selling unharvested produce. We’ll estimate the value of food loss on a per acre basis.
To the best of our knowledge, this study is the first to offer estimates of monetized values of food loss based on post-harvest field data.
Refresher on Sorting Crop into Market Groups
Before you can understand what prices you can expect for after market crops, you’ll need to understand the quality of what’s left in the field. We covered this area thoroughly in our earlier article.
But, it’s probably worth revisiting the section about the categories we sorted the test plot crops into:
After you harvest a test plot, sort the crop into three categories. Growers use a range of terms to refer to crops left in the field, such as surplus, ugly, culls, or seconds. For measurement purposes, it is helpful to categorize volume using categories that align with available markets. For example, we found these categories useful:
- Marketable: First- and second-tier product that could be sold on the wholesale market.
- Edible: Out-of-spec product that could be sold for processing.
- Inedible: Cannot be sold.
You base your decision to continue the harvest — to return to a field to harvest what otherwise will be “lost” — on the marginal cost and benefit of harvesting and packing your crop given its marketing opportunities. Let’s take a look at how you can learn if the prices will make another full harvest worthwhile.
We assume inedible produce to have zero value, and so we don’t include it as a source of revenue in our study.
Who Buys Lower Grade Produce?
Conventional sales channels into retail and food service markets typically require that products meet high aesthetic and quality standards. But a small but growing number of alternative markets exist for lower-grade products, such as “ugly produce” programs at grocery retailers and subscription box home delivery programs.
Food banks are another potential market for lower-quality produce. They will pay you a low price for your crop, but they may also offer tax deductions for charitable donations. In some cases, they will compensate growers for the pick and pack out costs of product. While these alternative channels do mitigate on farm food loss, it is not clear whether these prices are sufficient to offset harvest and packing costs.
Monetizing On-Farm Produce Loss
A farmer can justify returning to the field to harvest additional product when there is a financial incentive to do so. Using estimates of the mean amount of product left unharvested (reported in Johnson et al., 2018b), we generate estimates of the profit or loss that a farmer would incur by harvesting and selling this product.
We consider four scenarios, which reflect differences in sales price and packing requirements of different types of buyers.
Scenario 1. “Ugly produce” markets, such as produce-box programs or retail. These typically pay farmers 50% of the value of USDA No. 1 grade products.
Scenario 2. Food banks. We found crop sales to average about $0.07 per pound. These sales prices reflect those received by farms in the study region.
Scenario 3. Conventional and ugly produce market combo. You’re able to sell marketable produce (USDA No. 1 grade products) at 100% of the value. Meanwhile, you sell the edible portion of the harvest to ugly produce channels at 50% of the value.
Scenario 4. Conventional and food bank market combo. You’re able to sell marketable produce (USDA No. 1 grade products) at 100% of the value. Meanwhile, you sell the edible portion of the harvest to a food bank at $0.07/lb.
Cost Returns for Each Scenario
For our North Carolina market, here’s how each of those scenarios played out financially:
After Market Revenue by Crop
(Dollars per Acre)
| Harvest Scenarios | Bell Pepper | Cabbage | Cucumber | Summer Squash | Sweet Corn | Sweet Potato |
| 1. Ugly food markets | $466 | ($557) | $823 | ($137) | ($178) | $88 |
| 2. Food banks | ($97) | ($388) | $38 | ($277) | ($155) | $106 |
| 3. Conventional and ugly food markets | $1,059 | ($538) | $1,135 | ($116) | $5 | $515 |
| 4. Conventional and food banks | $580 | ($580) | $211 | ($289) | ($111) | $364 |
Amounts and Sources We Used in Our Calculations
- Wholesale prices: USDA AMS Custom Average Pricing Tool for USDA No.1 FOB product shipped from North Carolina in 2017.
- Harvest and packing labor requirements: Enterprise budgets, University of Kentucky, 2017.
- Labor cost: $14/hour based on total costs associated with H2A labor as reported by North Carolina growers.
- Packaging: $1.50 per cardboard box; $20 per wooden bin.
What This Chart Tells Us
Given the processing opportunities available in North Carolina, and assuming there is demand for the produce, only cucumbers and sweet potatoes offered consistently positive returns across each of the examined scenarios. These results do, however, vary considerably depending on the quality of the unharvested produce and the market opportunities.
An additional harvest of bell peppers and sweet corn may be profitable dependent upon the available market opportunities. In only the most conservative scenario (Scenario 2) was it unprofitable to reharvest bell peppers.
For sweet corn, at best, a small, $5/acre return is offered in circumstances where the recovered product is sorted and separately sold to marketable and edible “ugly produce” channels (Scenario 3). Partially due to the relatively high proportion of inedible relative to edible produce, harvesting abandoned cabbage and summer squash was found to be unprofitable under any of the examined scenarios.
Important Details You’ll Need to Consider
There are a few things we should mention at this point. Although we calculate revenue based on only marketable and edible produce, our estimated harvest costs include on all crops, including inedible.
This approach accounts for the loss of harvest labor efficiency later in the season due to (potentially) large volumes of inedible product. We include packing labor only for grading and packing that occurs in the packing house and is assumed to vary by the total marketable plus edible volume. That’s because growers can ascertain these labor needs by the harvested volume and adjust accordingly.
Marketable product is packed in cartons and edible “ugly produce” product is packed in wooden bins. Field pack into wooden bins for sales to the food bank market does not include an additional packing labor cost, as food bank staff or volunteers typically sort this product when packing it into smaller volumes for distribution. The cost of wooden bins is included in the food bank estimates (Scenarios 2 and 4), but it is worth noting that food banks increasingly supply plastic bins for growers to use.
Why This Study Can Differ in Other Regions
A few caveats of this analysis are worth highlighting.
First, it is important to note that these field losses do not include product that is sorted out in the packing house (culls). As such, this analysis reflects the potential profitability of returning to the field for an additional harvest rather than the incentive to sell or donate product that has already been harvested. Secondly, these estimates reflect the marketing opportunities and costs available in the study region (North Carolina) and may not apply in other locations.
For example, North Carolina has a large sweet potato processing sector, and local processing is available for some bell pepper growers. This approach further assumes that the labor needed for the additional harvest is available and can be hired at the same wage rates as during the regular harvest period.
Thirdly, this analysis implicitly assumed that there is a buyer for the recovered volume of produce and that the increased market supply would not impact market price. These volume and value estimates thus offer insight into the extent of loss for the examined crops in North Carolina but would require reconsideration of several assumptions to be relevant in other settings.
Editor’s note: This article summarizes a portion of Dunning and Johnson’s work on after-harvest crops. You can read the full study on the North Carolina State University site.


