


Change on the Radar for Florida Automated Weather Network
 February 10, 2020
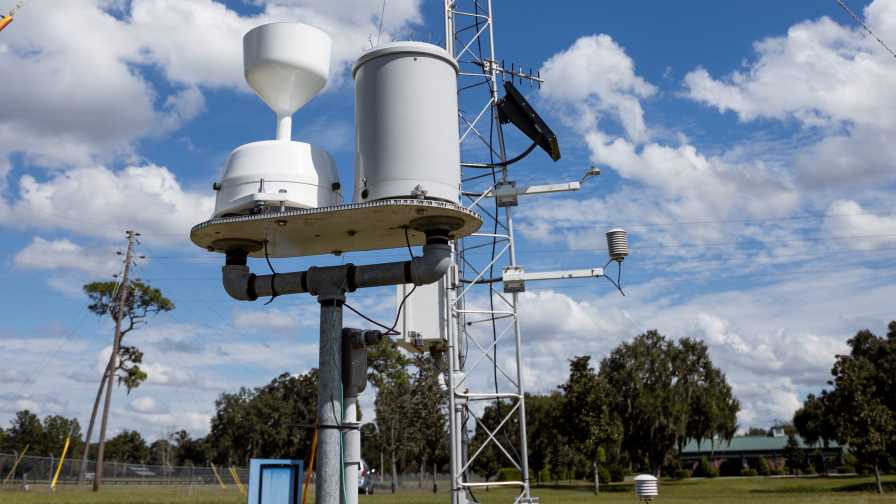
The Florida Automated Weather Network (FAWN) currently consists of 42 automated weather stations that collect data from Jay to Homestead every 15 minutes.
Photo courtesy of UF/IFAS
Weather-related information is essential to Florida’s agricultural producers for making important decisions regarding production. Since the mid-1990s, The Florida Automated Weather Network (FAWN), a program of UF/IFAS, has been providing data and a variety of digital tools that can aid growers in irrigation and cold protection strategies.
FAWN currently consists of 42 automated weather stations that collect data from Jay to Homestead every 15 minutes. Each station measures temperature at multiple heights, relative humidity, wind speed and direction, rainfall amount, barometric pressure, and solar radiation. FAWN also calculates wet bulb and dew point temperatures, evapotranspiration (ET), heat index, and temperature humidity index, which is used to evaluate heat stress in dairy cattle. You can view a brief, current measurement, a 36-hour National Weather Service (NWS) forecast, and NWS watches/warnings by simply placing your mouse cursor over a station on the homepage map. Radar images and animations also are available with a mouse click or finger swipe on your smart device.
Cold Protection Tools
You can access a full station measurement by clicking the displayed temperature at a station on the homepage. On the “station page,” current measurements, an NWS graphic forecast of several variables, including air and wet bulb temperatures, relative humidity, and rainfall can be displayed, as well as station location information, including photos and a map, and current radar images.
With one click, you can view FAWN’s suite of cold protection tools, which provide guidance for using water for cold protection. Recently, FAWN added “Chill Portions” to its decision-making tools. Chill Portions uses the dynamic model to estimate chill accumulation. It is displayed for the current year, and for the previous five years as well.
Personalized Options
Some additional decision making tools include daily ET, the Air Temperature Threshold Tool, which allows users to retrieve the number of hours a FAWN station measures temperatures above or below a user-specified value, various crop-specific irrigation schedulers, and a pesticide application forecast tool, which can be used to determine optimal conditions during which to apply chemicals. Users also can view and download archived data from each FAWN station.
Another source of data that FAWN provides is My Florida Farm Weather (MFFW). This high-resolution, farm-based weather station network provides growers with site-specific weather data that can be used to maximize water used for irrigation and cold protection. Each weather station measures air and dew point temperatures, wind speed and direction, relative humidity, and rainfall amount. Like the FAWN stations, data are collected from these stations every 15 minutes.
As with FAWN, decision-making tools are at the heart of the MFFW program. The cold protection toolkit, for example, is accessible. A forecast and graphs of data also can be viewed and downloaded into a spreadsheet.
There also is an app for the iPhone and Android platforms. Current data, graphs, map customizations, cold protection tools, and notifications are part of the app. Follow FAWN on Twitter @UF_FAWN.
Site Update Coming!
Next month, FAWN will release a new updated website. The website will continue to be packed with all the great data and tools that users have come to rely on for decision-making but will be displayed with a fresh look and feel and everything will be very easy to access.
Some new features will include a new interactive GIS-based zoomable map on which various weather measurements and map layers can be displayed, and where users can view the closest weather stations via the web browsers location services.
Each station page will show current data, tools, and forecasts as well.