


Q&A: Daily Satellite Imagery Service Moves into Specialty Crops
 January 8, 2020
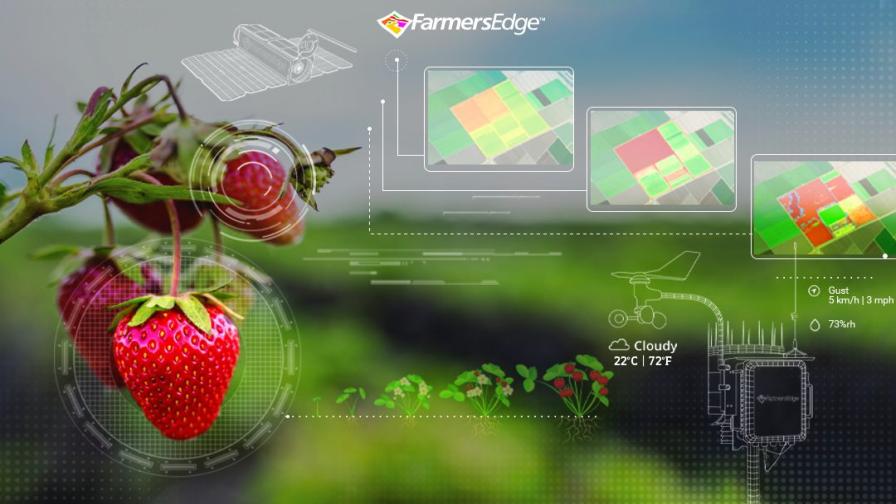
Photo Courtesy: Farmers Edge Newsroom
A digital ag tool that many row crop growers have found quite useful in the past, Farmers Edge’s exclusive-to-North-America daily satellite imagery acquisition portal, is making its way into the specialty crop markets in 2020, according to a recent press release from the Winnipeg-based ag tech outfit.
Now, just like their big acre brethren in corn and soybeans, lettuce and carrot and pepper growers that sign up with Farmers Edge can also punch their field boundaries into the startup’s mobile-based digital ag management software, FarmCommand, and order up near-daily satellite scans of fields.
We reached out to Scott Speck, regional digital ag lead for the group, to talk about imagery usage in specialty crop operations, and what growers can hope to achieve by signing up for the companies’ near-daily imagery product:
American Vegetable Grower (AVG): Anytime a new technology is launched, growers are keenly focused on how soon a return-on-investment (ROI) will be realized. What are some of the faster ROI use-cases for aerial imagery in specialty crops?
Scott Speck, Farmers Edge (SS): “Growers have been using Farmers Edge daily satellite imagery for a variety of crops for detecting fast, practical, and useful decisions to bring to the farm. Specialty crops are no different, and many times the ROI of finding an irrigation issue or a disease starting to spread in a specialty crop is much higher than in traditional row crops like corn and wheat. Some of the issues imagery can detect in a specialty market are irrigation issues (plugs, timings, amounts), diseases (both from individual locations such as a tree, and from outside sources coming in), and nutrient or input deficiencies leading to variation in final production or yield.”
AVG: One of the enabling technology suites within this near-daily imagery product is something Farmers Edge refers to as “Cloud Filtering Technology.” I assume this is a new capability around capturing imagery on cloudy, shady days?
SS: “When we obtain images, they are masked based on the mosaic of a large number of acres based on clouds initially. Following that large mask, they are then filtered by field borders. Fields that have more than one-third of the acreage covered by clouds are not displayed, while imagery with less than one-third acreage of cloud coverage are displayed. Clouds are detected and can also be shown in the RGB image to identify where and then can be masked and taken out of the derivative image sources we provide such as NDVI, our proprietary Scouting, Variation, and automatic Crop Health Change Detection map layers. We get multiple images of a field per day, increasing the likelihood of getting a usable image, especially in areas like the Central Valley, where clouds are less frequent. Being able to take pictures of those fields daily, and getting a high resolution, while at the same time filtering any clouds from the image gives us an excellent advantage for realizing accurate daily satellite imagery that is usable for the customer.”
AVG: It seems on first impression that specialty crop growers spend an inordinately greater amount of time physically walking and scouting their crops. For farmers that want to scout more efficiently, where does something like this fit into that workflow?

Scott Speck, Regional Digital Ag Lead, Farmers Edge.
SS: “With imagery, if I am scouting a cornfield at tassel, I can identify the exact spot to go even though I can’t see it from the road, and instead of wandering the field, I know precisely where the suspicious or areas of variability are occurring. With specialty crops, many times the folks in the field are focused on specific tasks such as harvest, weeding, or irrigation and may miss out on some of the changes or potential issues that could lead to production variability. Also, having multiple crops, plantings, and turns per year can get overwhelming when trying to figure out where to start the day. Just a few days of an undetected missed irrigation can cause high losses for specialty, and the imagery, especially our Crop Health Change Detection, and Notification toolset, can pick up these issues fast enough to warrant action.
“Unfortunately, though, not everything is directly noticeable to the human eye right away, and we may miss things if we don’t know what to look for – or more importantly, where. For example, our Variation Map works to catch water and irrigation issues sometimes up to 20 days before we see them in the field, or even on an NDVI layer.
“Imagery provides us with a great opportunity to manage risk by putting a different view on our fields and blocks while helping prioritize where to go when we need to spend that time in the field. One of our producers used the NDVI ratings by value and acres included at each value in broccoli to determine box count for production and a yield prediction. Our imagery displayed where the differences were inside the field, and his farm agronomy team was able to pinpoint specific spots to do yield checks on production and calculate what the yields would be to set realistic expectations and plan accordingly, instead of coming up short or long on their orders.”
AVG: Farmers Edge kind of got its start as a data company in weather stations and helping farmers collect and leverage what it called “hyper local” weather data. How are you integrating that data set into the imagery to unearth more and better insights for farmers?
SS: “Imagery is a fantastic tool for letting us know ‘where’ in the field to go, and can provide us and idea of when those changes are occurring that we may not expect. When looking at an integrated system like we offer with FarmCommand, weather stations take that insight further by providing current, historical, and forecast conditions at that field level. What is unique about tying weather data and agronomic data together is that we can use data science and predictive models to forecast when issues may be occurring based on the crop, planting date, planting depth, and weather conditions. Predictive models tell us when crops are susceptible to certain diseases or pests based on the crop and weather patterns, as observed at the field level with the weather stations. With imagery alone, we only know the ‘where’ before getting to the field but integrating imagery with the weather and predictive modeling allows us to better pinpoint the ‘what’ as a farm agronomy team.”
AVG: With the advent and proliferation of Application Program Interfaces (APIs) and the explosion of imagery products offered in ag since the mid-2010s, professional, photogrammetrically accurate crop imagery has never been more accessible to growers than it is today. Any thoughts on how grower usage of aerial imagery has evolved over the years?
SS: “There are thousands of use cases for imagery for specialty growers; at the end of the day, imagery is another tool for customers. For the tool to be useful, you can’t forget it at home or not be able to get it when you need it. As software and open APIs have created more partnerships, this has benefited the grower by providing more reliable and on-demand tools through this digital revolution. Also I should mention that growers can download imagery from previous days or years right from the field, to look for trends that may be re-occurring over the years. Having useful data and tools is critical but having accessibility when a grower wants and needs it, is crucial for seeing the value of the tools. We are pleased on the investment in our platform for accessibility, but also in our boots-on-the-ground team of people who work with the grower on set-up, training – both initially on the software and where the grower goals are, as well as continued training as we develop new features and uses each month.”
Subscribe Today For