



El Niño or Not — Ways Ag Producers Can Be Better Prepared in All Kinds of Weather
 August 26, 2026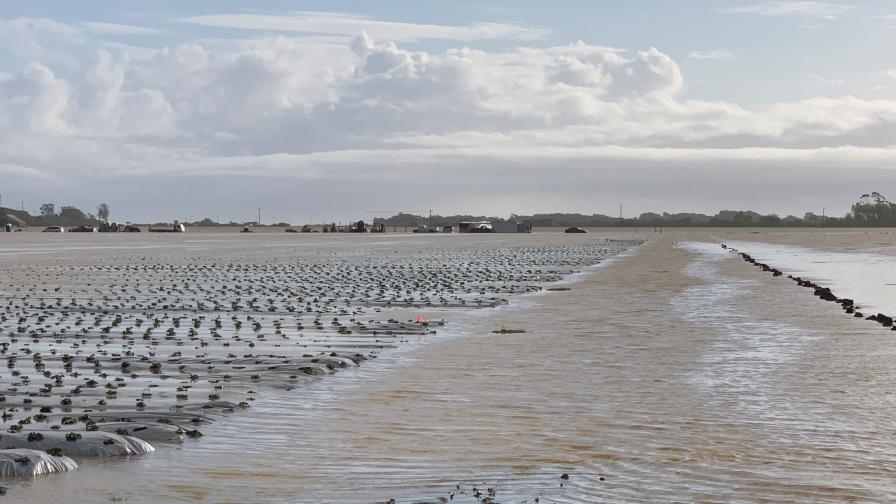
An inundated strawberry field in California after an atmospheric river event in early 2023. It was one of multiple excessive rainfall events during a moderate El Niño climate cycle.
Photo by Michael Cahn
There has been much hype behind the El Niño climate phase that’s been developing over the last few months. Why? Because scientists, climatologists, and media outlets are pointing to conditions that could make this one of the strongest El Niño cycles on record. Along with that comes increased chances of temperature and precipitation extremes — especially for some parts of the country. Are we witnessing a “Super El Niño“? While that is still to be determined, agriculture producers are left to deal with the weather that’s right in front of them.
Fortunately, technology is getting better in predicting weather patterns from season to season and even beyond. The data mined from those tools along with historical records can help growers stay a step ahead of not only short-term impact weather events, but also longer-term trends.
New York City-based Arbol is a global climate risk coverage platform and financial technology company that offers solutions for businesses looking to analyze and mitigate exposure to climate risk. New analysis from Arbol found while farmers are experiencing record temperatures, rising heat is tied to the long-term warming trend and not necessarily El Niño.
After analyzing 47 years of NOAA climate data, Arbol says that of the six U.S. agricultural regions studied, only the South Central and West showed clear effects of El Niño. And both point to wetter conditions, not extreme heat.
For example:
• In El Niño summers like the current one, the South-Central region is already seeing roughly 30% more heavy-rain days and dry spells are about 13% shorter than the all-year norm.
• If the super El Niño holds through winter, heavy-rain days are expected to rise about 26% in the West the following year.
The second observation tracks as places like southern California often experience “atmospheric river” events during El Nino years. Heavy rainfall events plagued parts of the Golden State during El Nino years of 2023, 2015, and 1998 respectively.
I had a chance to connect with Arbol CEO Siddhartha “Sid” Jha to discuss what’s not being talked about in the news regarding El Niño, and the real impacts farmers and agriculture producers should prepare for.
What services does Arbol provide that could directly benefit farmers and agriculture?

Sid Jha
Jha: We offer agricultural insurance covering both standard federal products and supplemental products such as parametric, which help cover gaps in standard products and we are expanding our presence in specialty crops. What makes that useful for specialty crops in particular is that much of what hurts a specialty operation is not the kind of yield loss federal programs are built around. It is rain in the harvest window that pushes fruit from fresh market to processing. It is a crew standing idle for a week that you still have to pay and house. It is a wet spring that compresses your planting window. Those show up on the P&L and frequently not on a claim form.
The tradeoff is real and I would rather state it than have a grower discover it later. An index contract can pay when your farm came through fine, and it can fall short when your farm did not. That is why the structure has to be built from your own history at your own location rather than from a regional average, and why we show growers what a contract would have done in each of the past twenty years before anyone signs anything. This sits alongside federal crop insurance. It does not replace it, and any broker telling a grower otherwise is doing them a disservice.
What should farmers be considering today when it comes to crop insurance and changing climate conditions?
Jha: Start with whether a program exists for what you actually grow, because the answer varies more than most people expect. USDA’s own research found dry beans and peas above 90% of acreage covered, cherries and plums around 87%, almonds and macadamias about 70%. Hazelnuts and lettuce came in under 1%.
That is not growers making different choices. RMA does not offer federal crop insurance policies for hazelnuts, kiwifruit, lettuce, squash, watermelons, most leafy greens, herbs, spices or root crops. For those growers, there is often no crop-specific program to buy. The comparison I find most telling is lettuce against pistachios. Similar acreage nationally, a bit over 200,000 acres each. Pistachios are more than 70% covered. Lettuce is close to zero.
The reason matters, because it points at the fix. Federal crop insurance has to be actuarially sound, which means RMA needs enough production and loss history in a given county to price a policy. USDA states directly that in many counties there are simply not enough producers of a given specialty crop to generate that data. Concentrated crops in concentrated geographies produce the records the system needs. Dispersed crops and crops with fewer growers do not, so the program never arrives. Hazelnuts show how long that can last: Oregon acreage has roughly tripled in 15 years to nearly 100,000 acres, and the industry is only now working with consultants to put a submission in front of USDA.
This is where the real opportunity sits, and it is a technical point rather than a sales one. The federal system needs loss data, which for many specialty crops does not exist at sufficient resolution. A parametric contract needs weather data, which exists for every county in this country going back decades. Coverage can be written where the traditional system cannot reach, not because anyone is being clever, but because the two approaches depend on completely different inputs.
Where you have a good MPCI (multi-peril crop insurance) program, use it. It is subsidized and we are not. The gap I am describing is the acreage where no program exists at all, and that is a much larger share of specialty agriculture than most people outside it realize.
Two other things worth watching. Federal coverage is built on your own production history. So, if your baseline drifts down across several hard years, your guarantee drifts with it. And most programs pay on yield while a great deal of specialty crop loss is quality, so you can bring in a full crop worth half what it should be because it rained in the wrong 10 days.
How can specialty crop growers use this El Niño data on their own operations?
Jha: First, check whether it applies to you at all. The reliable signal in our analysis is regional. It concentrates in the South Central states and the West, and four of the six agricultural zones we tested showed no dependable El Niño effect in any metric. If you are growing in the Southeast or the Northeast, this event does not tell you much, and I would rather say that than let you plan around a signal that is not there.
If you are in the affected regions, the useful part is timing. The South Central signal is a this-season issue and it is wetter, so the questions are drainage, rain intensity around harvest, and disease pressure. The western signal, if it materializes, is a next-year issue and depends on this El Niño holding through winter. That is an unusual gift in agriculture. You have months of warning rather than days.
The specific thing I would look at for specialty crops is disease, and it is not the obvious one. It is not only that there is more rain. It is that the dry spells between rain events get shorter, so canopies stay wet longer. Extended leaf wetness is the main driver of fungal infection, and a season with identical total rainfall distributed differently can be a much worse disease year. If the pattern holds where you are, that is a spray program conversation with your advisor now rather than in June.
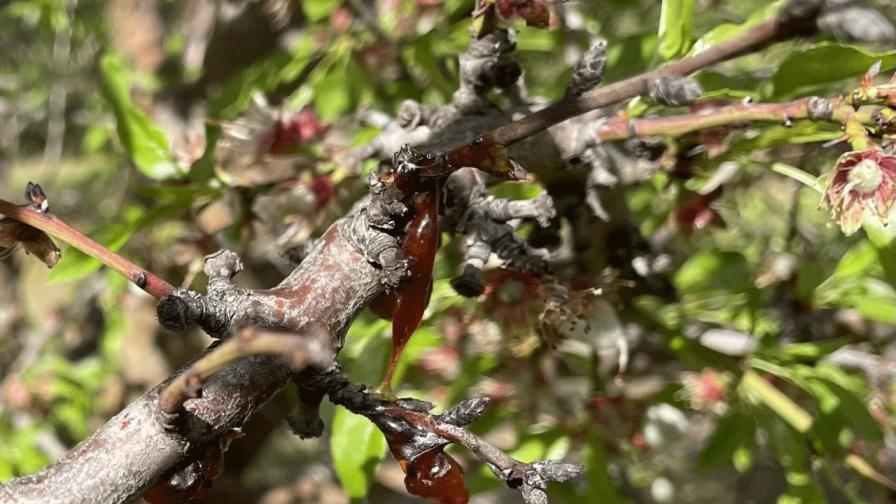
An almond tree with the pathogen Phytophthora syringae. The pathogen is usually found in tree roots but intense storms in early 2023 created the right conditions for the pathogen to “swim” up trunks.
Photo by Emily C. Dooley/UC Davis
How does the data differ between a normal El Niño and a Super El Niño?
Jha: Two things, and the second matters more than people expect. The first is that it is not linear. A stronger event does not simply do more of what a moderate event does. Above a certain strength the circulation response shifts, so effects that were mild can become pronounced while others behave differently than a moderate-event composite would suggest. Scaling up a normal El Niño pattern to fit a strong one is not a safe assumption.
The second is statistical and it is the honest limitation. There have been very few very strong events since reliable records began. NOAA is currently saying there is a 69% chance this one exceeds every El Niño back to 1950, which is a way of saying the closest analogue may not exist. Small sample means wider confidence intervals, so we have the least statistical certainty about exactly the events people most want forecast. Anyone giving you a precise number for what a super event does to your county is overstating what the data supports. That is why we present this as a direction and a region rather than as a forecast. Wetter, in these two areas, with the West conditional on the pattern persisting. That we can stand behind.
Are you seeing similar patterns during La Niña events?
Jha: The one thing I can speak to directly from our own work is what does not reverse. The warming trend in our data runs straight through El Niño years and La Niña years alike. Extreme heat days and growing degree days have been climbing regardless of phase, and growing degree days are rising significantly in all six regions we tested. That tells you the oscillation is not what is driving the heat, so you cannot wait out a phase change and expect the temperature side to return to where it was.
On La Niña’s own moisture signature I would point you to NOAA rather than to us. The general climatology is that it tends to run drier across the southern tier and wetter in the Pacific Northwest, but we tested El Niño effects specifically and I do not want to present a La Niña finding we have not published.
The practical difference growers should know is duration. El Niño typically runs about a year. La Niña often persists across multiple years, and consecutive dry years compound in a way that a single dry year does not, particularly on irrigation districts and groundwater. For a perennial operation that is the harder one to manage.
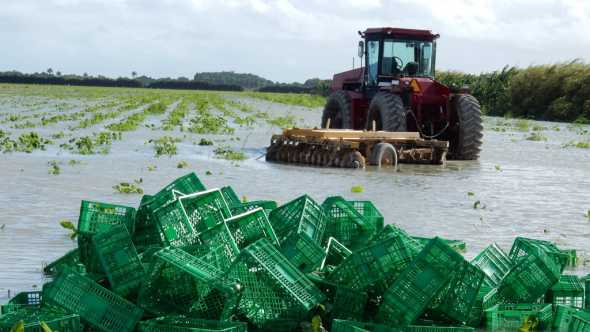
Flooding in South Florida in early 2016, which was the tail end of a strong El Niño cycle. Photo courtesy of FDACS
Anything else for specialty crop growers and industry stakeholders?
Jha: There is one thing that does not get enough attention. Growing degree days are rising in all six regions we looked at, El Niño or not. For perennial crops that means bloom arrives earlier, and the last frost date has not moved as fast as bloom has. So, the window where a tree is vulnerable and a frost is still possible has been widening. That is a very expensive exposure for anyone with orchards or vines, and several of the worst specialty crop losses of the past decade were bloom frosts rather than summer droughts.
The broader point is that heat is a trend and El Niño is a cycle, and they need to be planned for differently. A cycle you prepare for and ride out. A trend you build into variety selection, site decisions and your capital plan, because it is not going back. The useful posture toward this El Niño is preparation rather than alarm. The signal is specific and regional, most of the country is not in it, and the parts that are have months of warning. That is a better position than agriculture is usually in.
 Loading ...
Subscribe Today For
