The COVID-19 pandemic has put a lot of things in perspective. One of those is the importance of food production. Supply chain issues and labor shortages aside, specialty crop growers continue to pump out an impressive amount of produce for our plates.
1
of
10
1
of
10
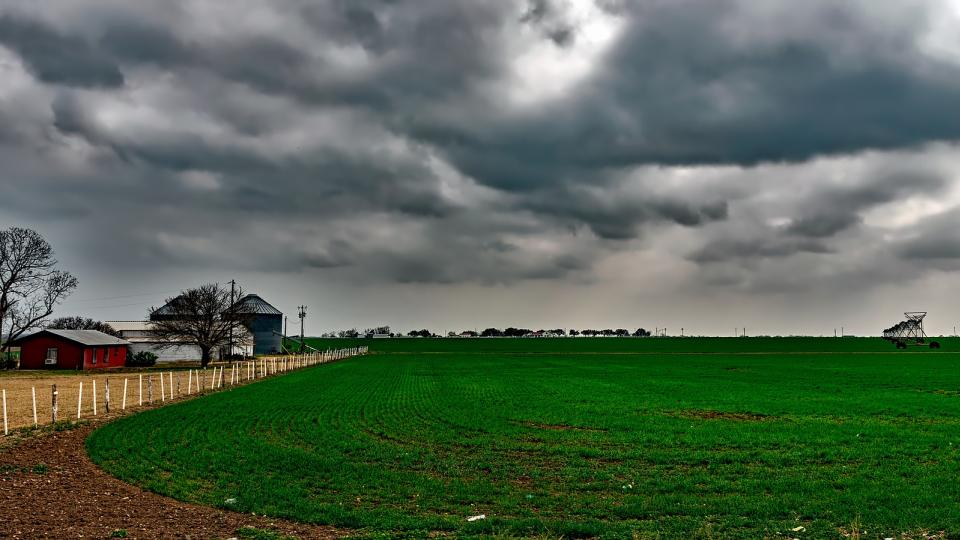
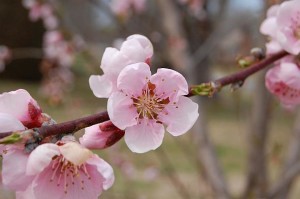
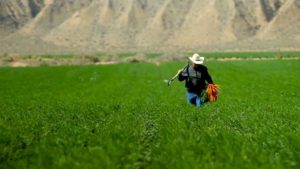
10. Texas
Total fruit & vegetable production: $348,246,000
Share of U.S. total fruit & vegetable production: 0.82%
Total fruit production: $163,350,000
Total vegetable production: $184,896,000
2
of
10
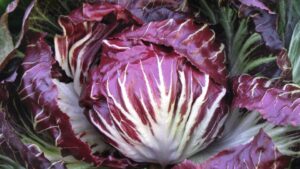
9. New York
Total fruit & vegetable production: $503,842,000
Share of U.S. total fruit & vegetable production: 1.19%
Total fruit production: $276,937,000
Total vegetable production: $226,905,000
3
of
10
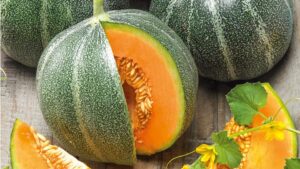
8. North Carolina
Total fruit & vegetable production: $560,492,000
Share of U.S. total fruit & vegetable production: 1.32%
Total fruit production: $60,811,000
Total vegetable production: $499,681,000
4
of
10
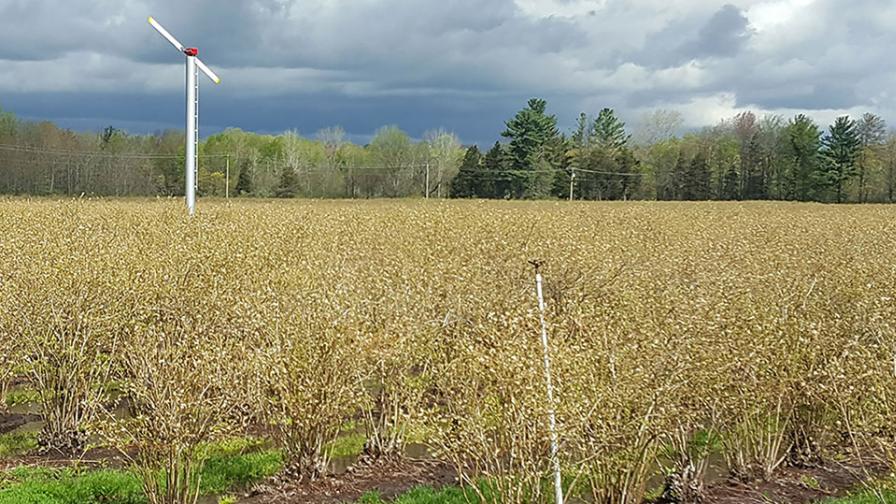
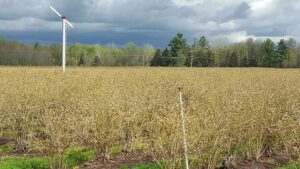
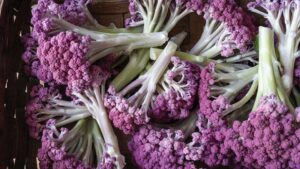
7. Michigan
Total fruit & vegetable production: $578,847,000
Share of U.S. total fruit & vegetable production: 1.37%
Total fruit production: $361,709,000
Total vegetable production: $217,138,000
Photo by Mark Longstroth
5
of
10
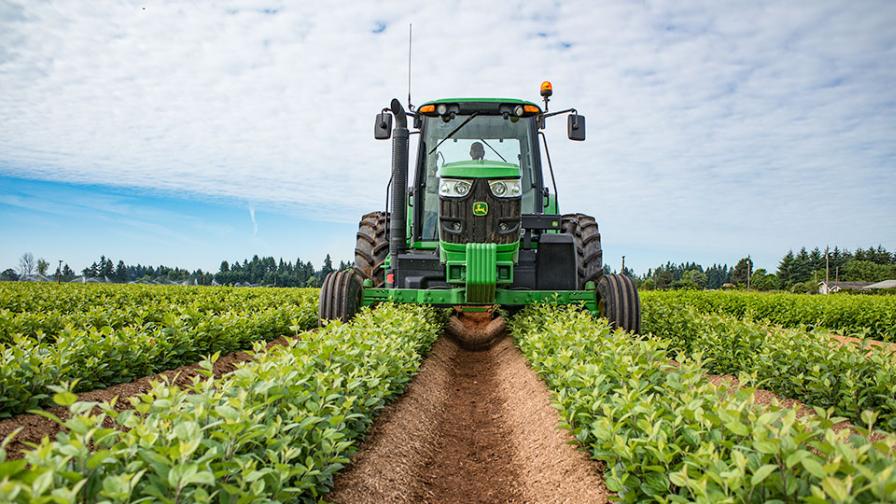
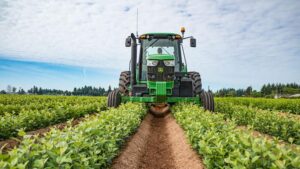
6. Oregon
Total fruit & vegetable production: $650,912,000
Share of U.S. total fruit & vegetable production: 1.54%
Total fruit production: $456,326,000
Total vegetable production: $194,586,000
Photo by Jon Christopher Meyers, TRECO
6
of
10
5. Georgia
Total fruit & vegetable production: $823,604,000
Share of U.S. total fruit & vegetable production: 1.95%
Total fruit production: $308,074,000
Total vegetable production: $515,530,000
7
of
10
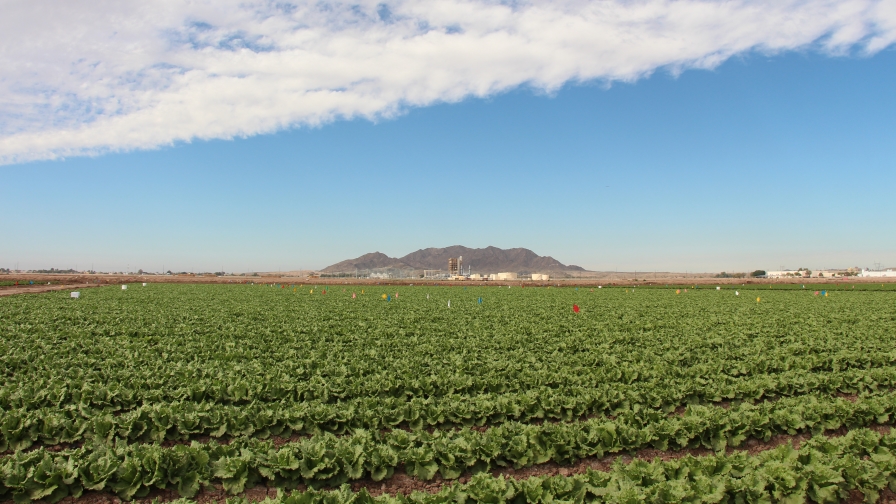
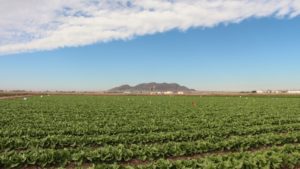
4. Arizona
Total fruit & vegetable production: $1,825,539,000
Share of U.S. total fruit & vegetable production: 4.31%
Total fruit production: $197,188,000
Total vegetable production: $1,628,351,000
Photo courtesy of University of Arizona
8
of
10
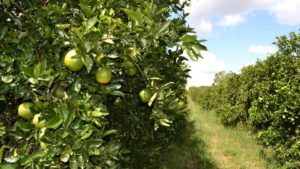
3. Florida
Total fruit & vegetable production: $2,759,462,000
Share of U.S. total fruit & vegetable production: 6.52%
Total fruit production: $1,536,612,000
Total vegetable production: $1,222,850,000
Photo by Paul Rusnak
9
of
10
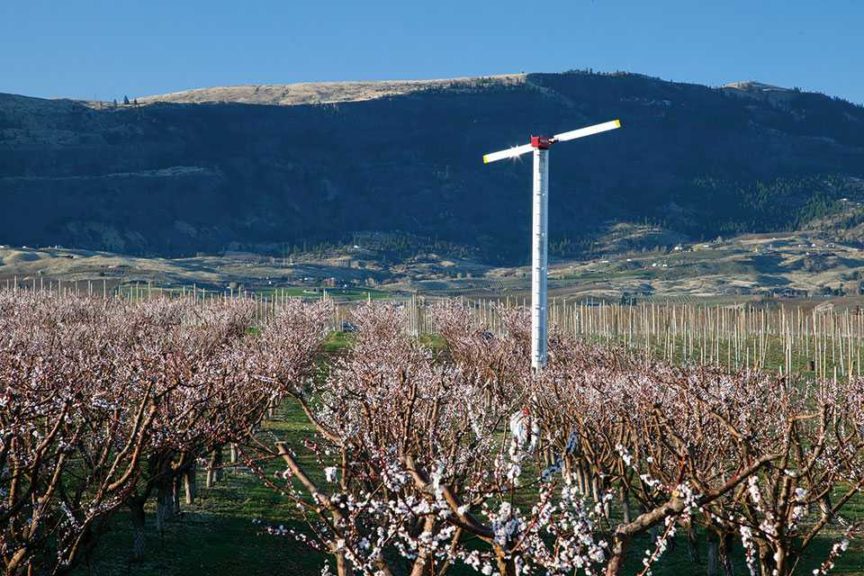
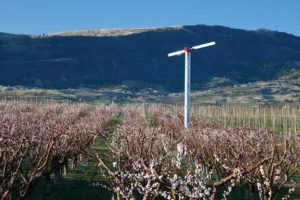
2. Washington
Total fruit & vegetable production: $3,396,600,000
Share of U.S. total fruit & vegetable production: 8.02%
Total fruit production: $3,033,860,000
Total vegetable production: $362,740,000
Photo courtesy of Heidi Burmeister, Marketing Director, Orchard-Rite
10
of
10
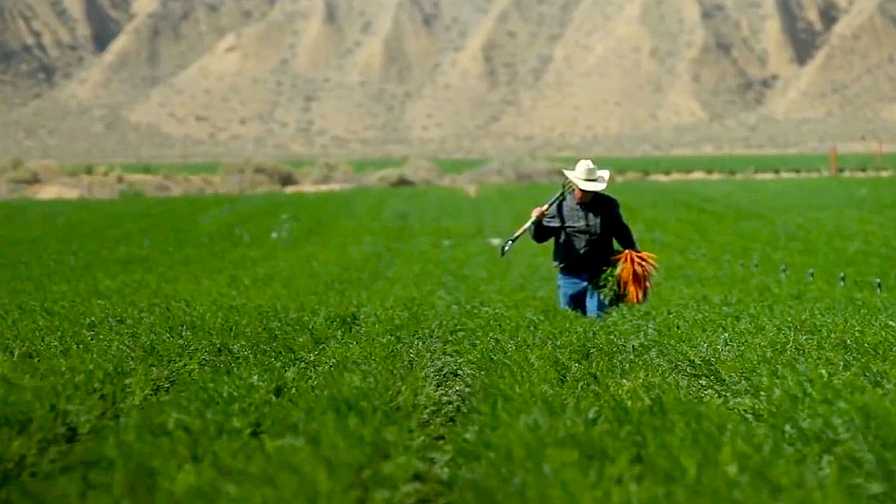
1. California
Total fruit & vegetable production: $29,181,329,000
Share of U.S. total fruit & vegetable production: 68.94%
Some U.S. states certainly carry a bigger load when it comes to fruit, nut, and vegetable production. The folks at Commodity.com recently compiled data that identifies the top producing states. To do so, they calculated the total production value of the crops measured in dollars.
According to Commodity.com, all data gathered for the analysis is based off 2019 USDA stats.
Scroll through the photo gallery above to see how the Top 10 U.S. states in fruit and vegetable production stack up.
665By the Numbers: The Top 10 U.S. States for Fruit and Vegetable Production
Subscribe Today For
Paul Rusnak is the Senior Multimedia Specialist for Meister Media Worldwide's Specialty Crops Division, which consists of American Vegetable Grower, American Fruit Grower, and Greenhouse Grower, all Meister Media brands. He is based in Northeast Florida.
See all author stories here.