


High Tech Tools Help Bullseye Farms Hit the Mark in Irrigation
 May 17, 2022
Bullseye Farms is a diversified operation that grows 17,000 acres of vegetables, grains, and tree nuts, including 4,000 acres of almond trees. Located in California’s northern Central Valley, they irrigate their crops throughout the dry summer season. Like other California growers, they constantly contend with drought-related problems.
Six years ago, Bullseye Farms began working with Ceres Imaging to access high-resolution aerial imaging of its farmland, along with site-specific analytics, to help it optimize its irrigation strategies. When Geoff Klein joined Bullseye Farms as Irrigation Manager four years ago, he continued to work with Ceres.
“In the beginning, we mostly used their data to help make decisions for irrigation and fertility, but we also discovered their uniformity data helped a lot during tree harvest,” Klein says. “We found that the drier spots would shake differently during harvest, so our harvest crews actually found those (reports) really useful.”
BIG DECISIONS
Going into the 2021 growing season concerned about uncertain water availability, Klein explains that he was working with Ceres to adjust the frequency of data-collecting flights.
“We usually fly it at least twice a year to make sure there aren’t any big changes in uniformity in a field, but we were flying some fields with known problems more frequently.”
And then the year changed. “We had crazy extenuating circumstances,” Klein says, referring to the 2021 heat wave that hit Yolo County beginning in July and lasting into August. With several weeks of temperatures of 100°F or higher, groundwater levels decreased rapidly, and wells lost pressure. Klein’s job of irrigating crops across thousands of acres became more complicated.
It got so bad, he and his boss had to decide whether to keep the tomatoes or the trees alive. It was an easy call.
While Klein worked with his crew to build a mile-long irrigation pipe from an underused well to a field that had a failing well, he also watched the weather prediction reports. Seeing that 100-degree days were still on the horizon for several weeks, he realized he needed a way to predict how much water he was going to need to use, based on field-specific crop coefficient (Kc) values.
“When we have limited water, using it in the right spot is the best thing we can possibly do,” Klein says. “So for predicting how much water we need to apply, the Kc is really critical.”
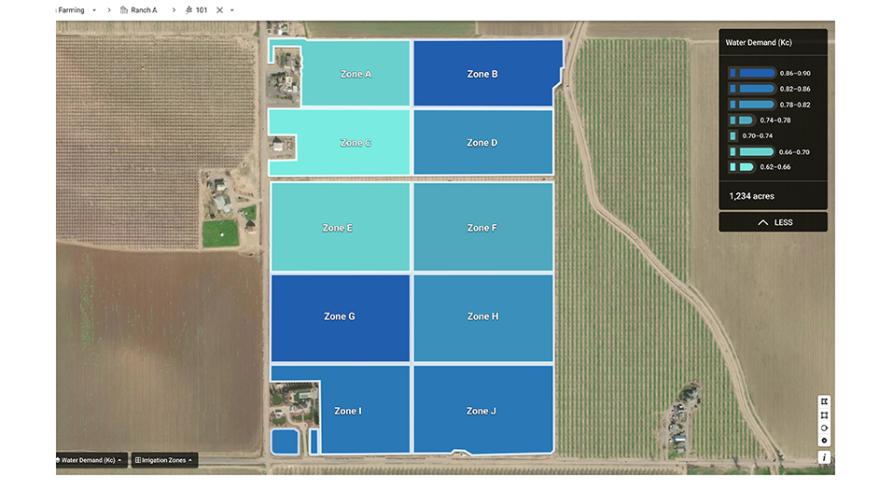
Growers like Bullseye Farms use water demand maps to account for variability in canopy size, accurately calculating evapotranspiration rates — and optimal irrigation — across different areas of their fields.
Image courtesy of Ceres Imaging
ALTERNATIVE PLANS
While one of the most common ways to irrigate is using evapotranspiration (ET) and reference evapotranspiration (ETo) modeling, Klein has found no success with the method.
“One of the biggest assumptions the university makes when making that model to calculate tree water use is the size of the tree because the size of the tree canopy is the amount of transpiration that a tree can be pushing through it,” Klein says. “The university makes an assumption (based on tree age) about the tree size, but unless you actually go out there and measure the tree itself, then their formula doesn’t work.”
Working with a pilot program of about 400 acres of almond and walnut trees, Klein explains, “I asked Ceres if they had a way to map Kc use so that we can use that new [field-specific] Kc value, plug it into a [weather] program and predict how much water we need to apply for a whole week starting Monday … because then we can break that up into different irrigation sets and plan some things and do all that without having to check every single day if it needs water.”
Using Ceres’ field-specific Kc maps, Klein was able to irrigate according to the Kc values, essentially giving 20% less water to trees that were 20% smaller than other trees in the same field.
Based on the farm-specific data generated by aerial imaging, this winter Klein had his irrigation crews decouple other irrigation sets across the farm in areas where he could identify variable water needs based on aerial imaging.
Klein explains his plan to use farm-specific Kc maps in the future.
“Now that we have the automation to make slight changes in real time, we have precise control [of irrigation], but we need to know how much to change the amount of water … anywhere we have a lot of variability is somewhere that we would want to have the Kc mapping done. I would do it on all the fields that I knew had a uniformity issue.”
Subscribe Today For